Table of Contents
- Devices
- The NIS in the line
- How to implement the NIS in the field
- Interfaces
- The LED TV (Andon board)
- The Andon board interface
- The touch panel interface
- Advancement of the pieces
- Declaring scrap
- Tooling
- Declaring stop for failure or slowdown
- Declaring stop for organizational cause
- Production change
- The flashback function
- In the office
- NIS web platform
- The main menu
- Users
- The environment
- Non-compliant causes
- Downtime causes
- Productions
- Utilities
- Reports
- Production line status
- Efficiency
- Reports
- OEE overview
- How does it works
NIS user handbook
Devices
The NIS in the line
NIS is an acronym that stands for Next Improve System. NIS allows the control and monitoring of production efficiency, both real time (Andon) and in a certain period (OEE).
How to implement the NIS in the field
To implement a NIS system, you need the following devices:
- A TV LED (we recommend a size from 40 inches up)
- A mini PC
- A Tuch Panel
- A Barcode reader
- A PLC
For each line production there will be a touch panel and a LED TV (The Andon board).
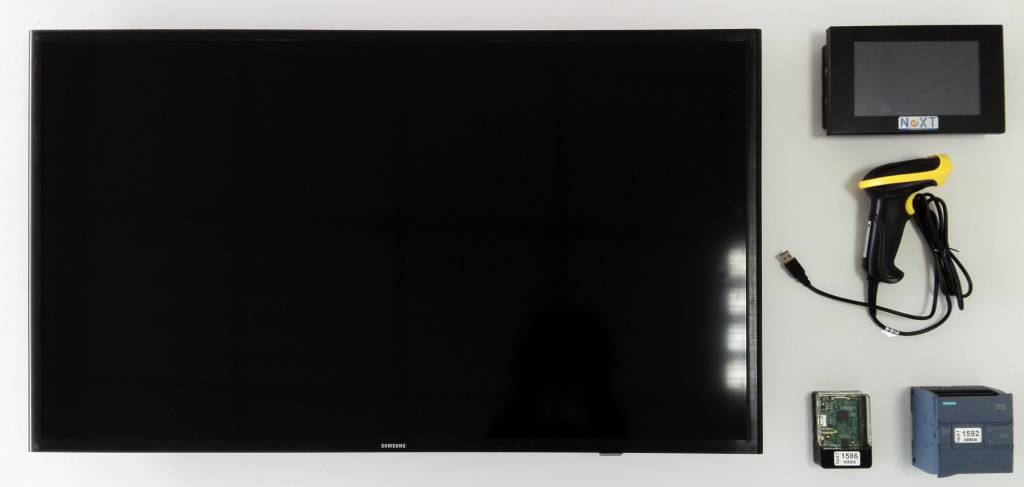
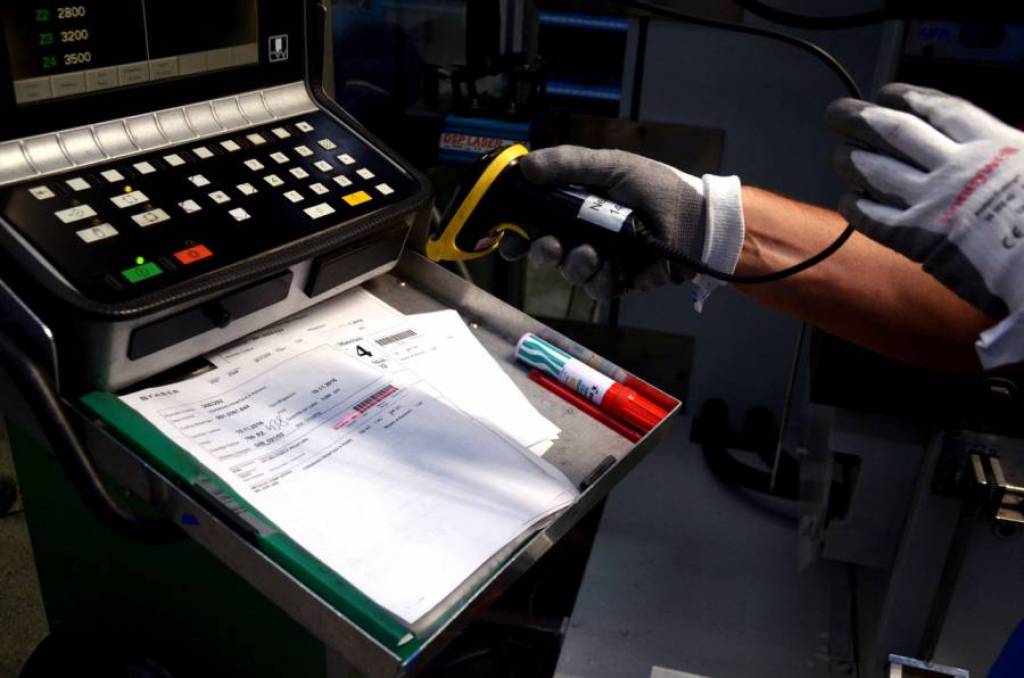
Connected to the touch panel there is the barcode reader that will help the operator to change the production order and, in case of absence of the PLC, to increase the number of pieces produced.
The barcode reader is connected to the touch panel via a USB port. The touch panel is connected to the system via ethernet cable.

The Mini PC is connected to the LED TV via HDMI port; it’s also connected to the system via ethernet cable.

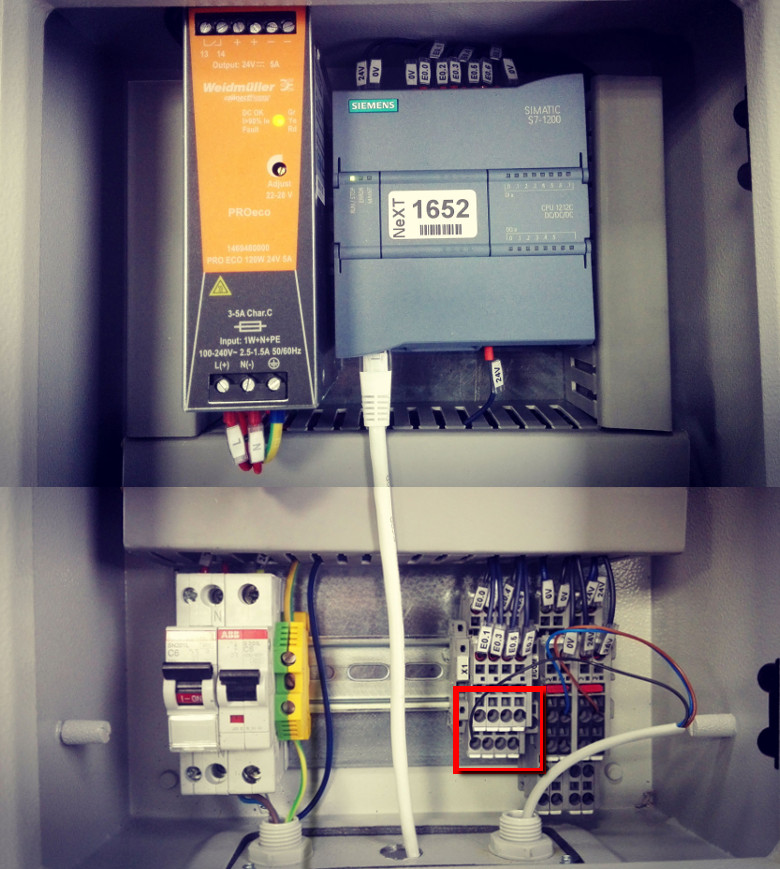
The main difference to a line without a PLC, concerns the signaling mode of the advancement of a piece: the PLC automatically sends a signal, when the operator performs the last operation.
Another signal from the PLC regards if the machine is running or not.
Each PLC can be connected to 4 machines because it is provided with 8 slots.
Interfaces
The LED TV (Andon board)
The Andon board interface
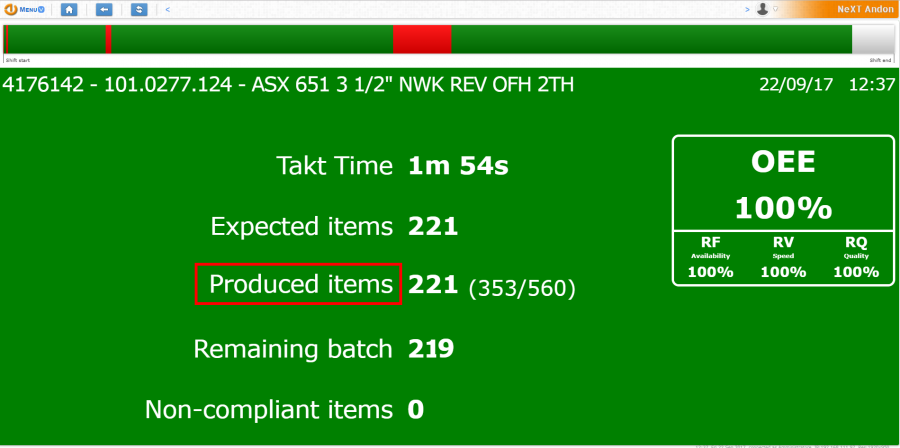
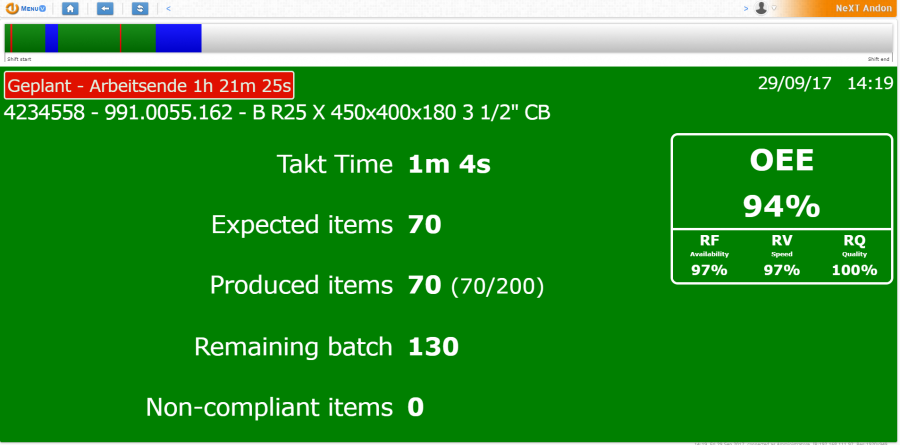
At the top of the page, a horizontal bar shows the sequence of stops of any type (programmed stop, stop for maintenance, etc.).
In green, the time the line is running, in red when it is stopped, in blue when the stop si scheduled.

Let's see the meaning of each element:
- At the top on the left there is the «Production Order code» currently ongoing
- At the top on the right there is the date and time
- Takt-time: is the time that each operator has to carry out its task
- Expected items: it represents the theoretical production
- Produced items: it represents the number of produced products, both goods and scraps
- Remaining batch: the number of pieces that remain to complete the entire lot production
- Non-compliant items: the number of parts not good (scrap items)
- OEE: on the right there is the OEE value expressed as a percentage, referred to the current shift. Single percentages are also specified for availability, speed and quality
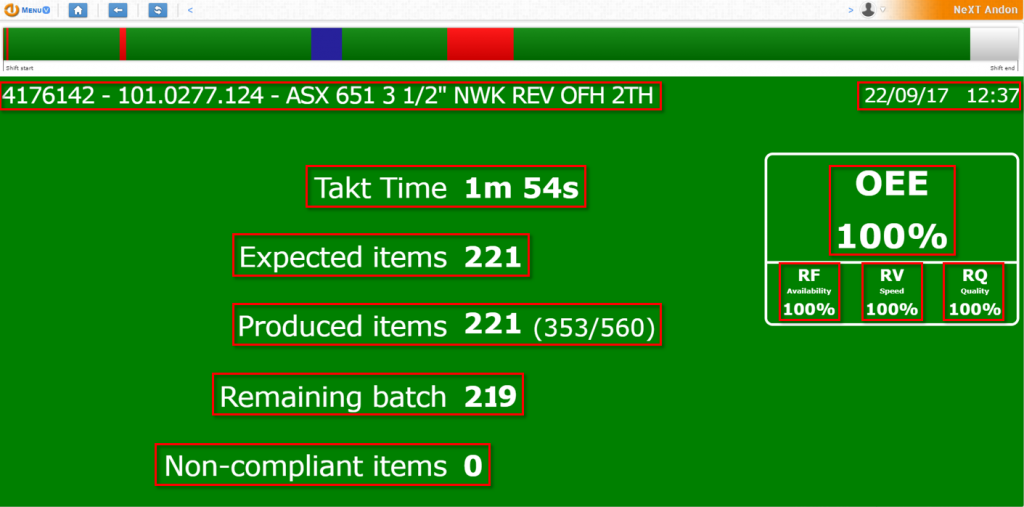
Even the colors of some elements have a specific meaning.
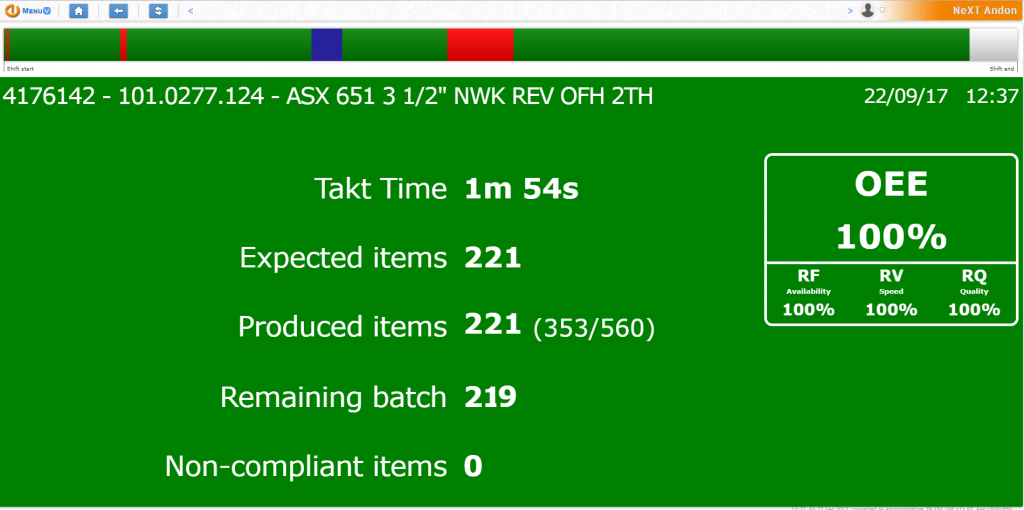
Green background: the background is green when the number of the «Expected items» (for current production) is equal to the number of «Produced items».
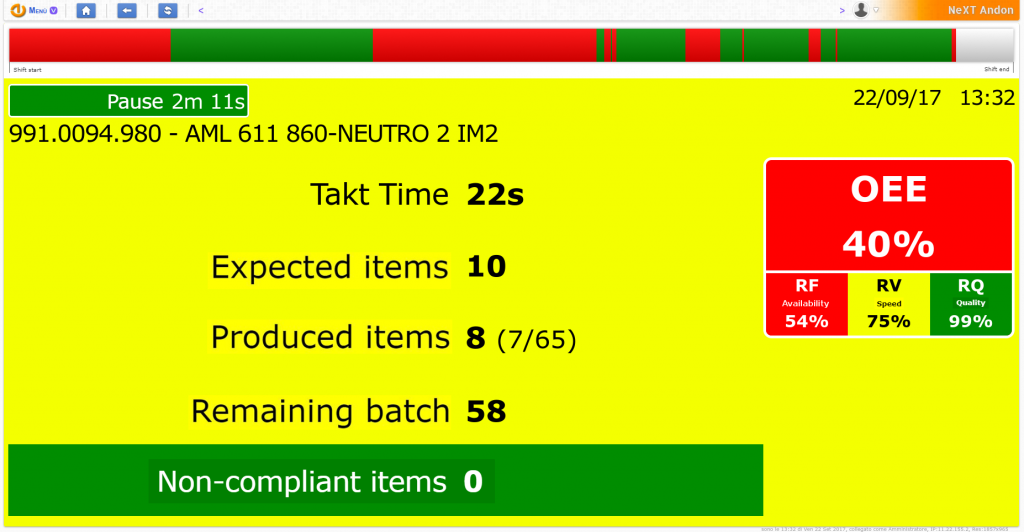
Yellow background: the background is yellow when the number of the «Expected items» (for current production) is greater than one or two items compared to the number of «Produced items».
Red background: the background is red when the number of the «Expected items» (for current production) is greater than the number of «Produced items» of three or more.
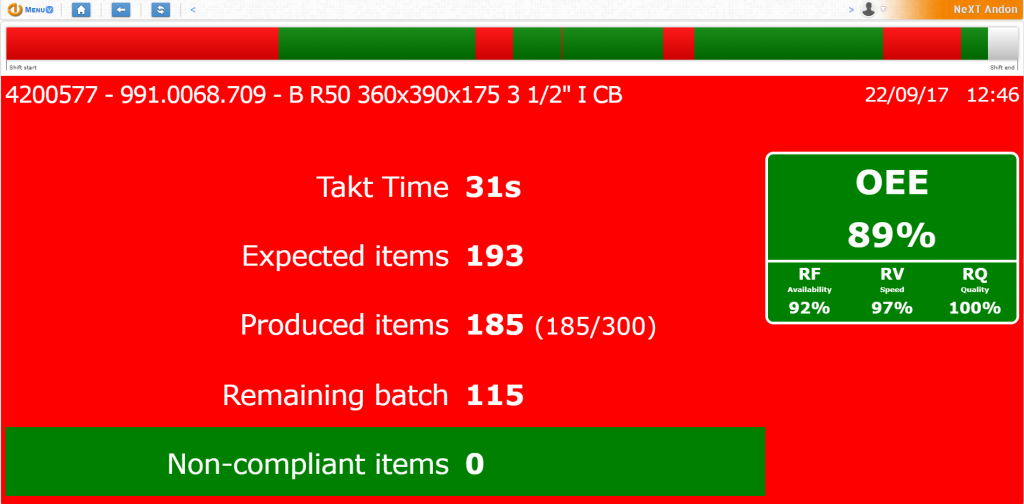
Also the area “Non-compliant items” has its own background color. Now we see the meaning of these colors.
- Green background: there were non scrap items
- Yellow background: there were one or two scrap items
- Red background: there were three or more scrap items

Also the box that hosts the percentage of OEE will appear with different colors.
- Green: the percentage value is greater then 81%
- Yellow: the percentage value is between 71% and 80%
- Red: the percentage value is between 0 and 70%
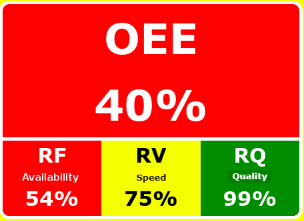
These percentage values can be customizable line by line, so they may differ from those shown in this guide.
Likewise, the individual boxes of "Availability", "Speed" and "Quality" can take on different colors.
The touch panel
The touch panel interface
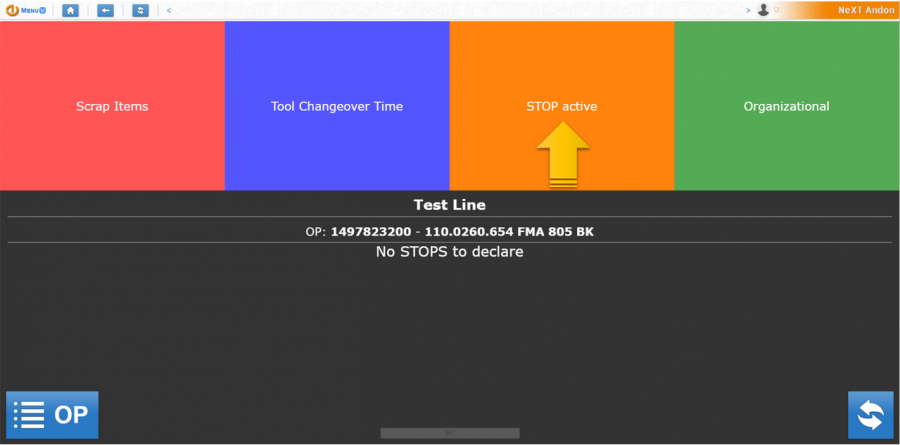
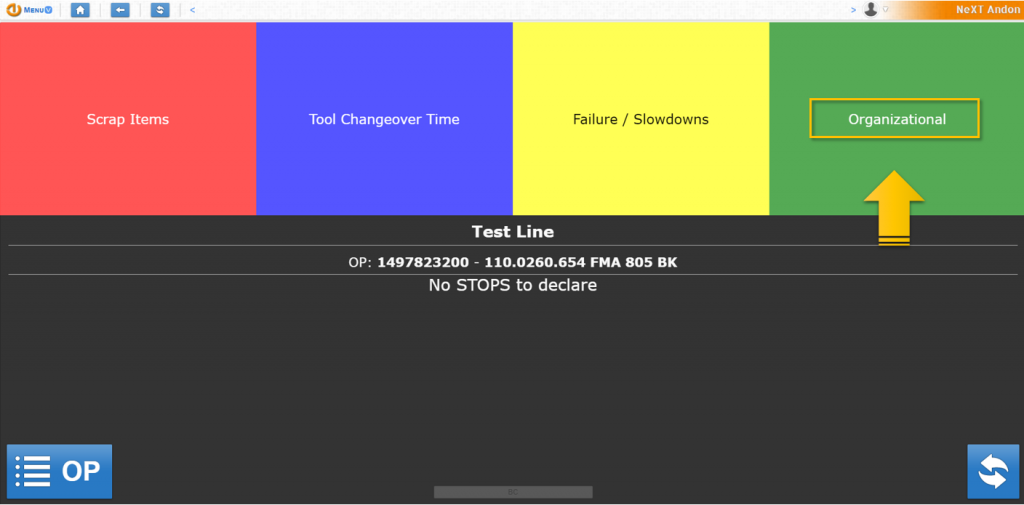
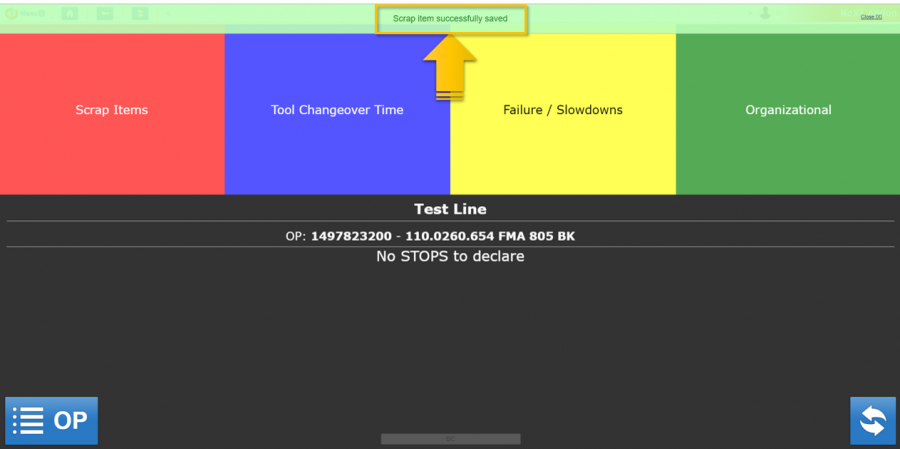
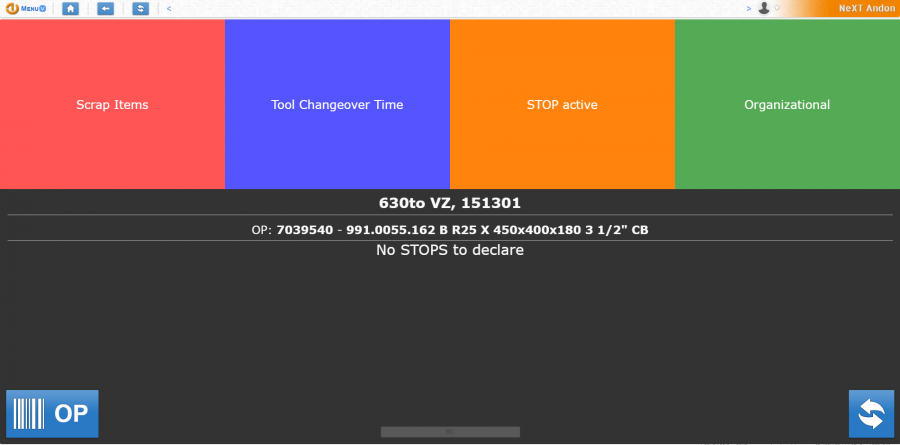
This is the interface of the touch panel.
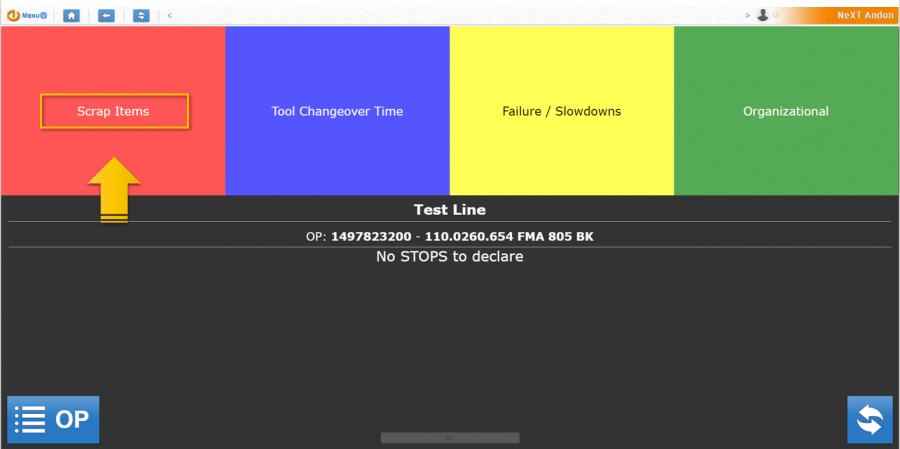
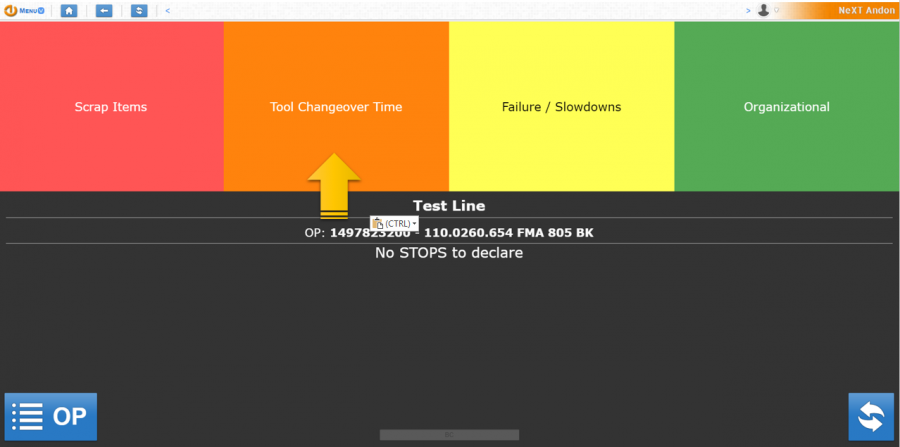
The red, blue, yellow and green areas are buttons that allow the operator to access certain functions.
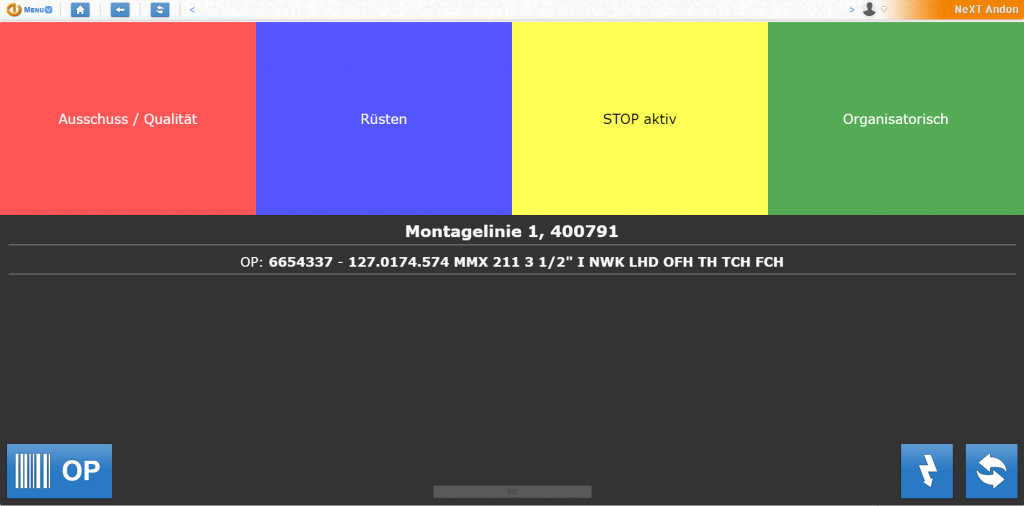
The «Scrap items» button provides access to a dialog box containing the datasheet of the loss of quality causes. The operator must specifies the appropriate.
For more information, see paragraph «Declaring scrap».
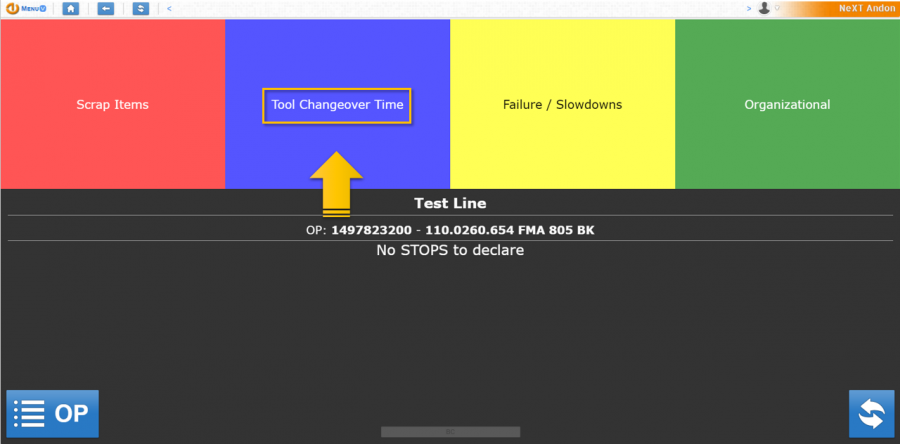
The «Tool changeover time» button provides to start the setup process.
For more information, see unit «Tooling».
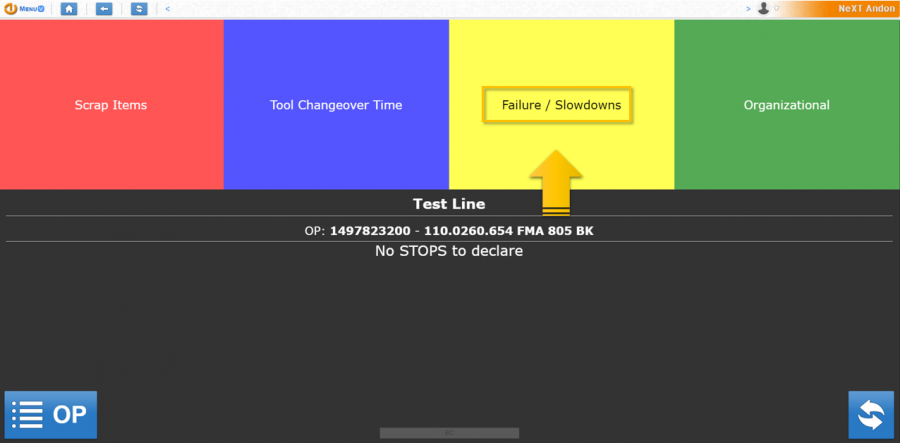
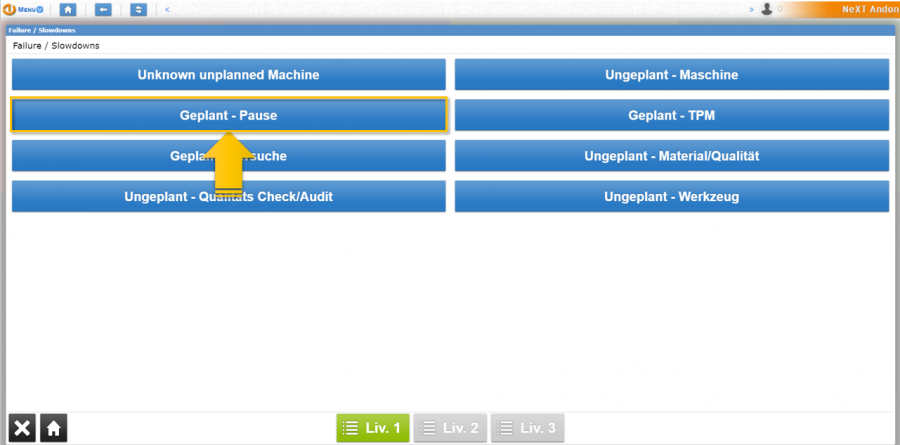
The «Failure / Slowdowns» button provides access to a dialog box containing the datasheets of the causes of the stops.
The operator must specifies the appropriate.
For more information, see unit «Stop for failure or slowdown».
The «Organizational» button provides access to some particular stop causes that have to concern organizational factors.
The operator must specifies the appropriate cause.
For more information, see unit «Declaring stop for organizational cause»
Below the four buttons, you can read the name of the line and the order of production that is processed at that time.

At the bottom on the left, there is the «OP button» that allow the operator to change the production order.
For more information, see unit «Production change»

At the bottom on the right, there is the «Flashing back» button that allow the operator to switch, to SAP, quantity of produced units and non-compliant items.
For more information, see unit «Flashback function»

Near the «Flashing back» Button there is the buttun to refresh the page.

Advancement of the pieces
Here we’ll show how to do the advancement of the pieces (with or without a PLC).
Without a PLC
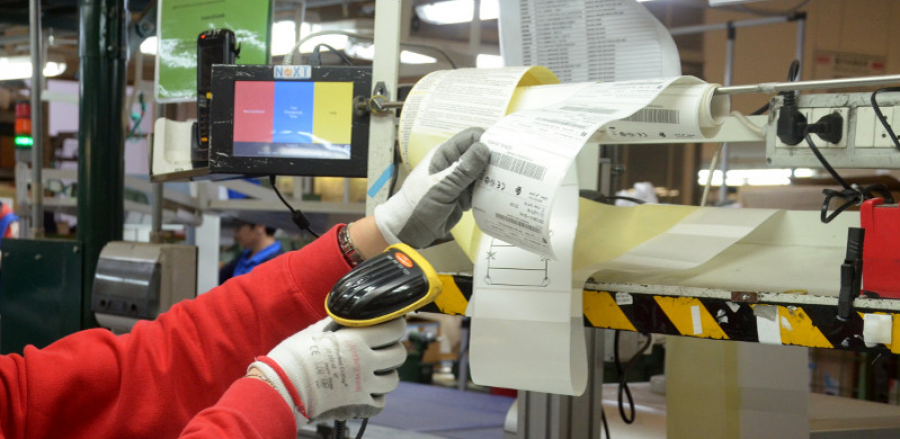
When the operator finishes all the operations, before moving on to the next piece, he/she will indicate the progress of the piece using the barcode reader, scanning the univoque item number.
With a PLC
The main difference, to a line without a PLC, concerns the signaling mode of the advancement of a piece: it is the PLC that, automatically, sends a signal, when the operator performs the last operation.
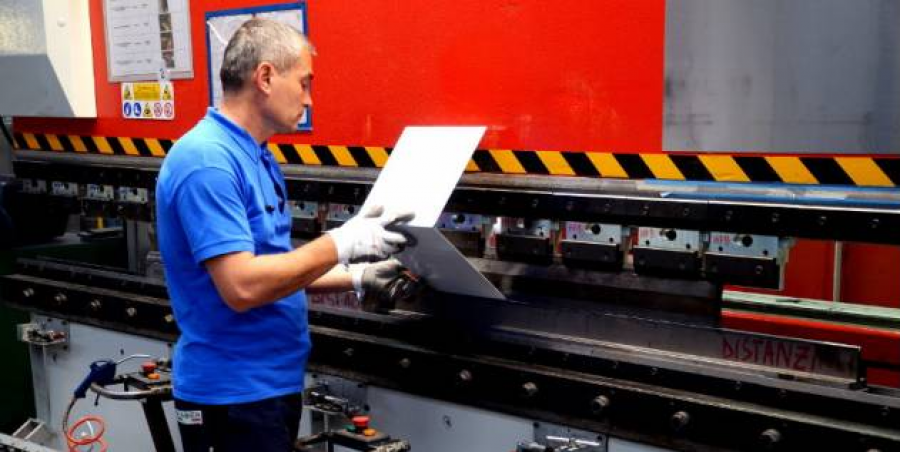
The number of pieces will be updated on the Andon board (LED TV), under the heading «Produced items»
Declaring scrap
The following paragraph will show how the operator can declare the scrap items.
- Press the red area called «Scrap items»
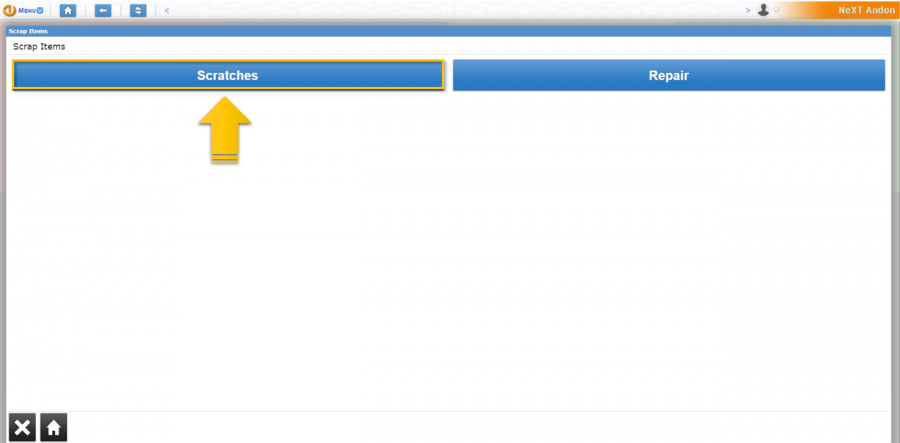
- The operator has to choose from a list of causes
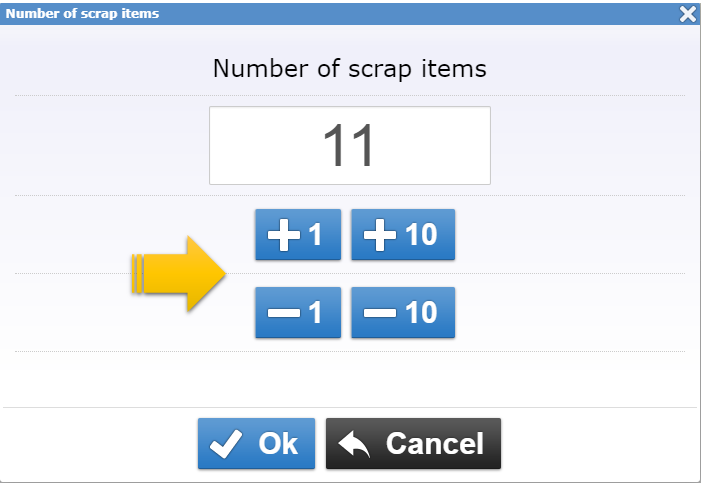
- Once the type of defect has been chosen, the operator can define the amount of pieces to be discarded
A message will inform the operator that the scrap declaration has been successful
Tooling
The following paragraph will show how the operator can start the tool changeover time.
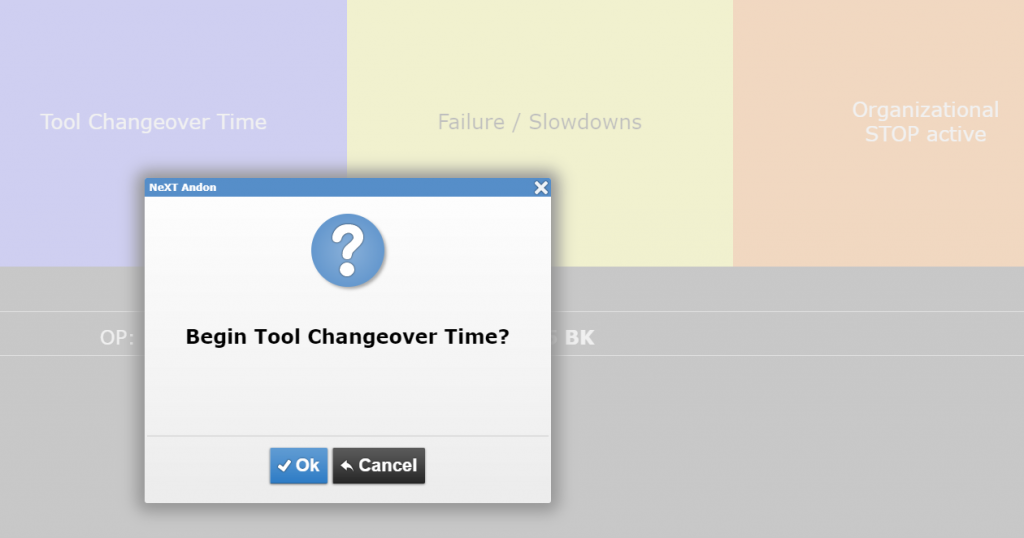
- Press the blue area called «Tool changeover time»
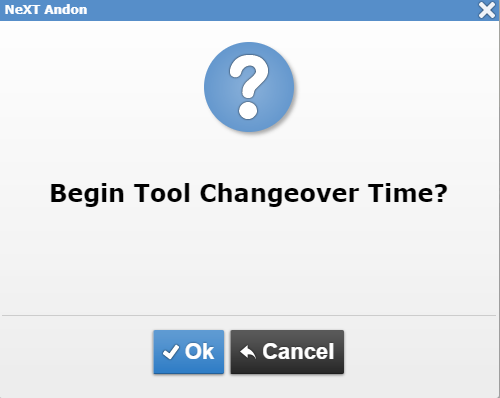
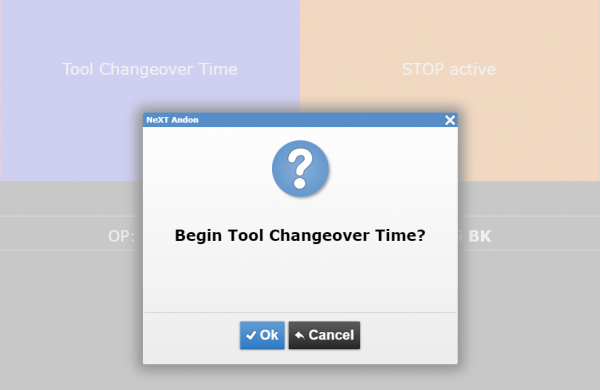
- The system will ask for confirmation of the choice to start the tooling
- Once the tooling has started, it will start blinking blue/orange for the entire duration.
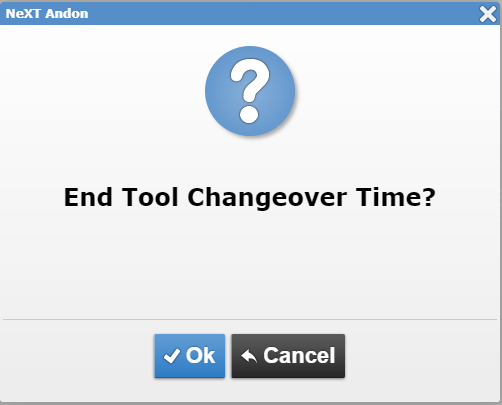
- Press the blinking area to end the tooling. The system will ask for confirmation.
Declaring stop for failure or slowdwn
The following paragraph will show how the operator can stop the system for failure or slowdown
- Press the yellow area called «Failure/slowdowns»
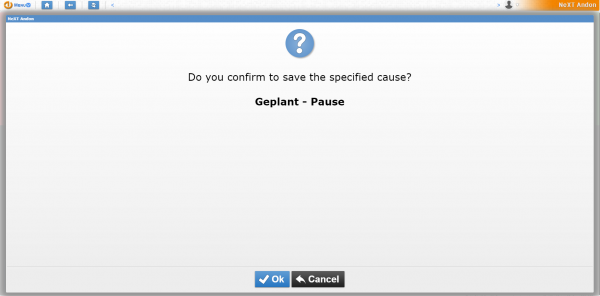
- The operator will have to choose the correct stop cause
- The system will ask for confirmation of the choice
- Once the stop has started, it will start blinking yellow/orange for the entire duration
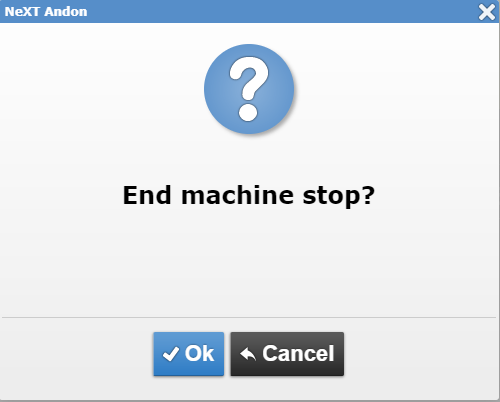
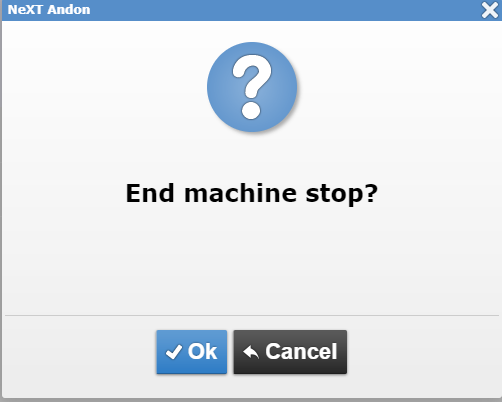
- Press the blinking area to end the stop machine. The system will ask for confirmation
- It’s also possible to switch from the stop machine, to tooling while stop is active
Declaring stop for organizational cause
The following paragraph will show how the operator can stop the system for an organizational cause
- Press the green area called «Organizational»
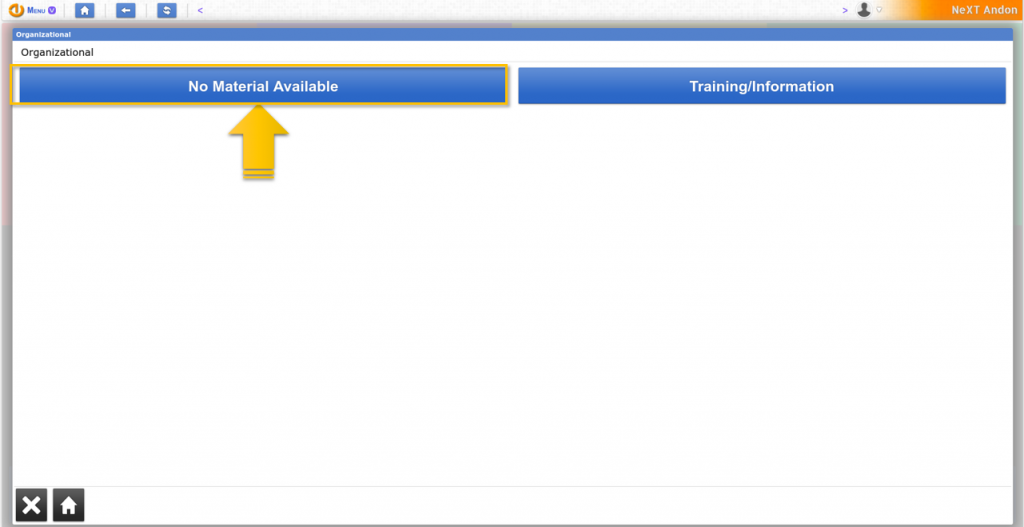
- The operator will have to choose the correct organizational stop cause
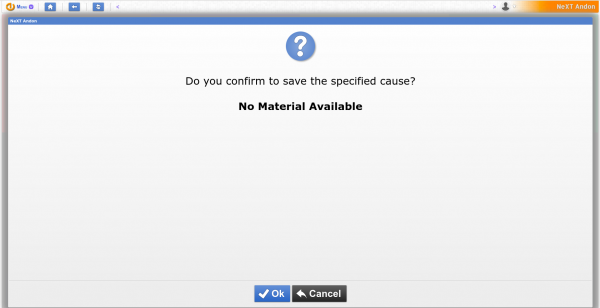
- The operator will have to confirm the choice
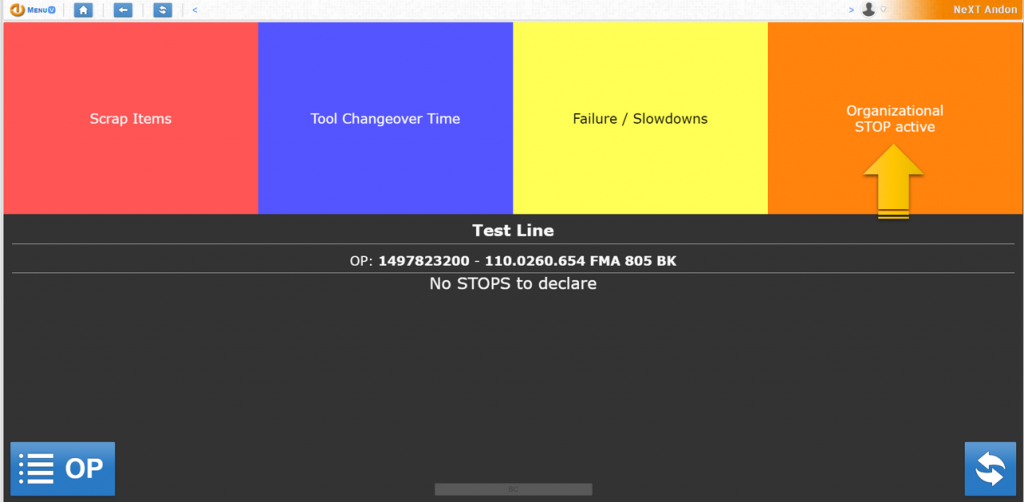
- Once the stop has started, it will start blinking yellow/orange for the entire duration
- Press the blinking area to end the stop machine. The system will ask for confirmation
- It’s also possible to switch from the stop machine to tooling while stop is active
Production change
The following paragraph will show how to change a production
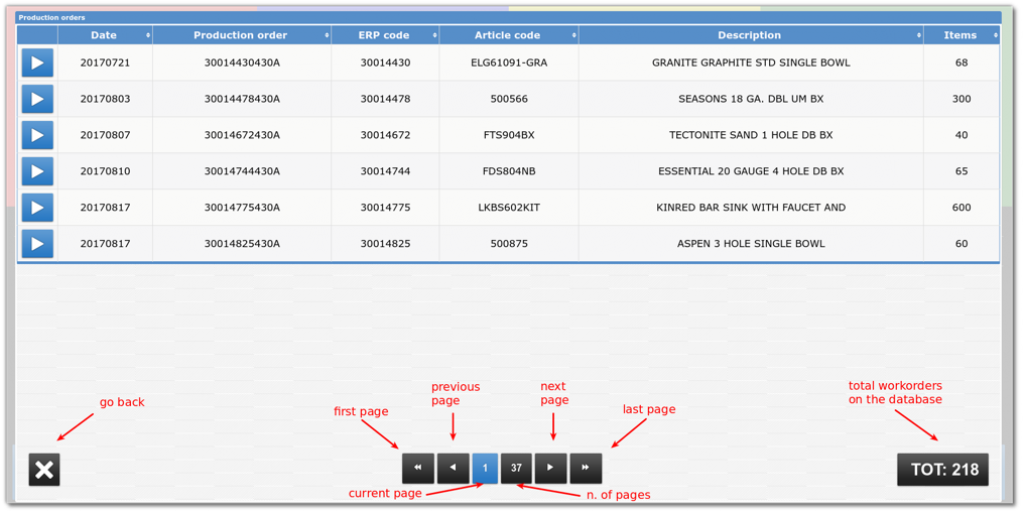
- Open the list of workorders and Press on the "OP" button to open the list. That list is sorted by release date in ascending order.
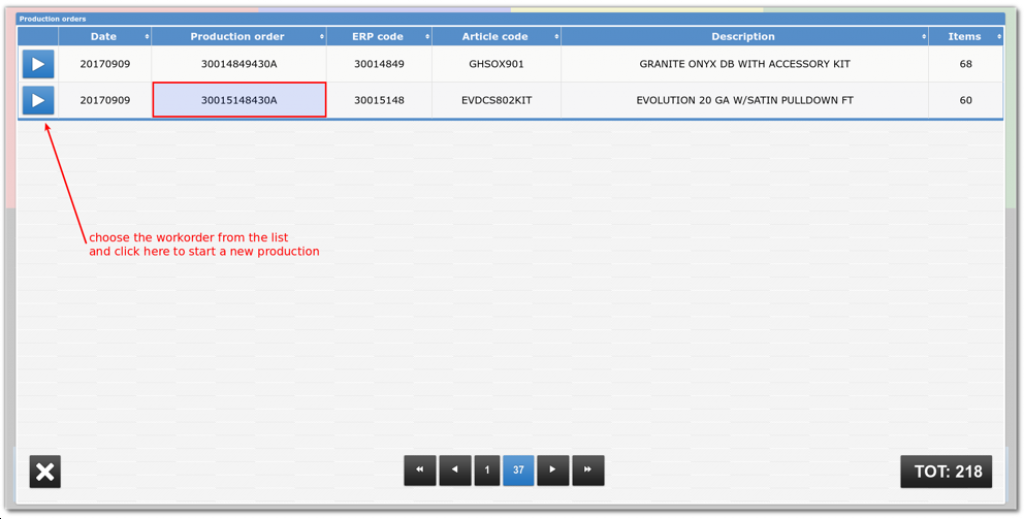
- Choose the workorder from the list. Use the buttons at the bottom to navigate.
- Press the "Play" button on the desired workorder to start a new production. A confirmation message will be shown.
- Verify information on the touch panel. The new production will be configured and the information about the selected work order, will be shown on the touch panel.
The falshback function
Th flashback function allows the operator to switch to SAP, quantity of units produced and non-compliant items.
- Press the button at the bottom on the right, representing the icon of a lightning
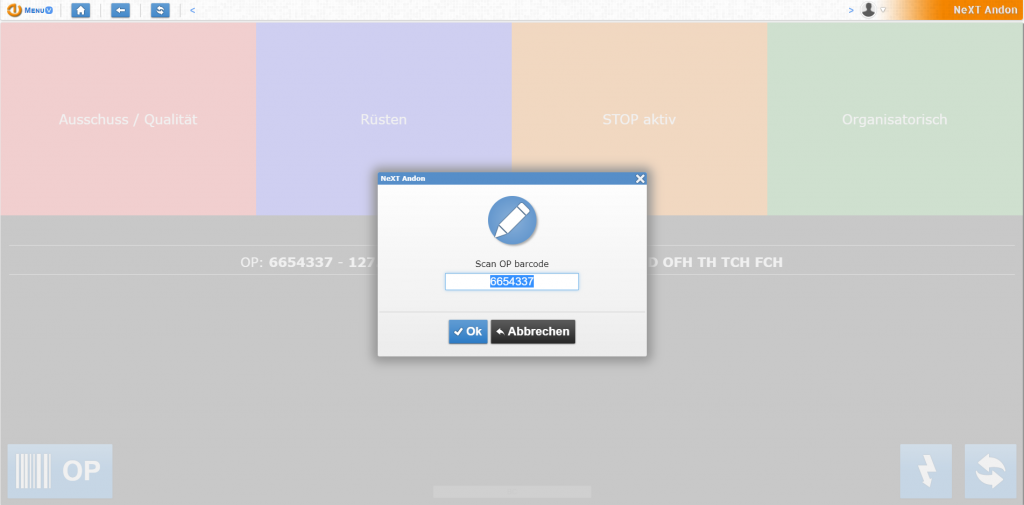
- Enter the RUEK code. By default, the system proposes the current production code.
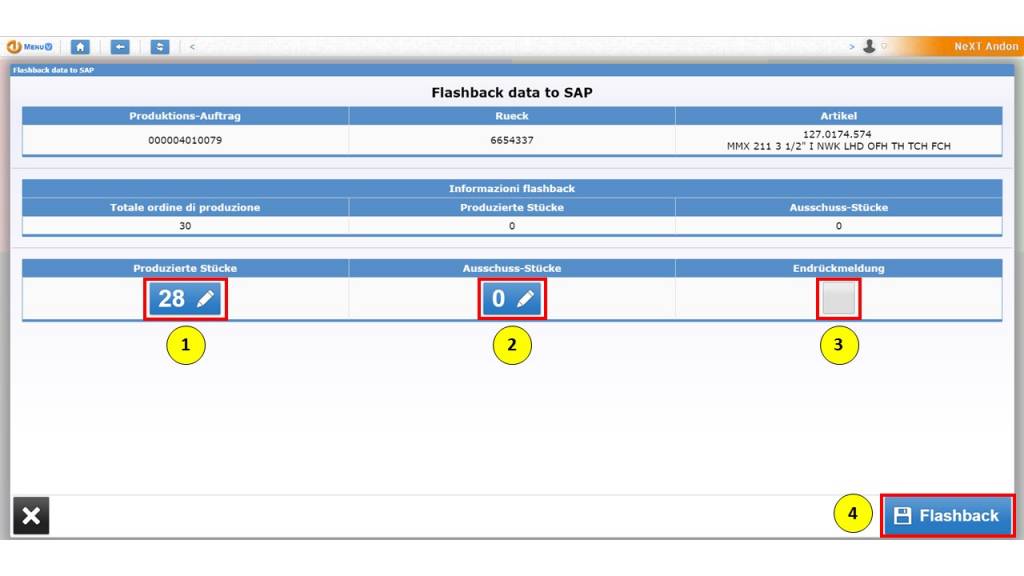
- From this screen the operator can communicate the quantity of units produced up to that time, and the quantity of non compliant items. The operator may also modify:
- the quantity of units produced (1)
- the amount of non compliant items (2)
- he can declare the order completed (3)
- finally, the operator must press the "Flashback" button at the bottom right (4)
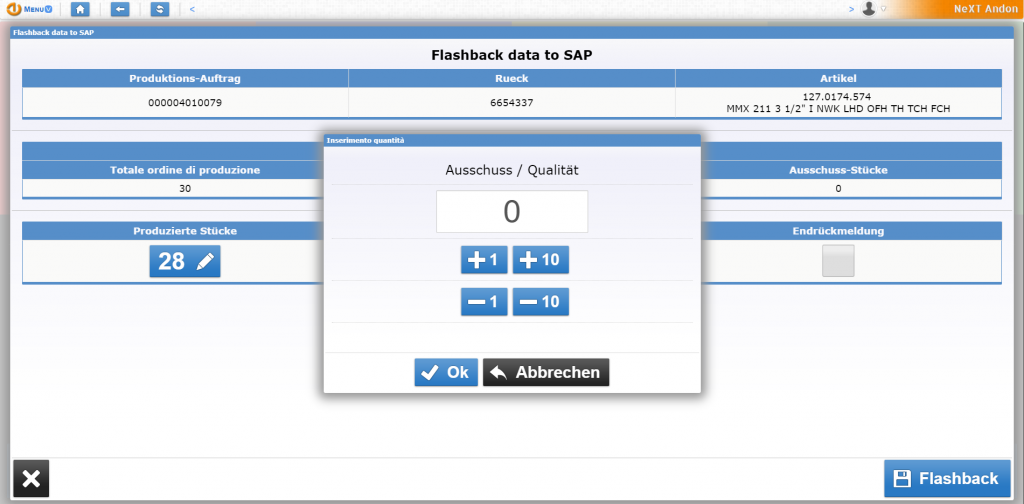
- This is the screen to change the amount of units produced.
- This is the screen to change the amount of non compliant items.
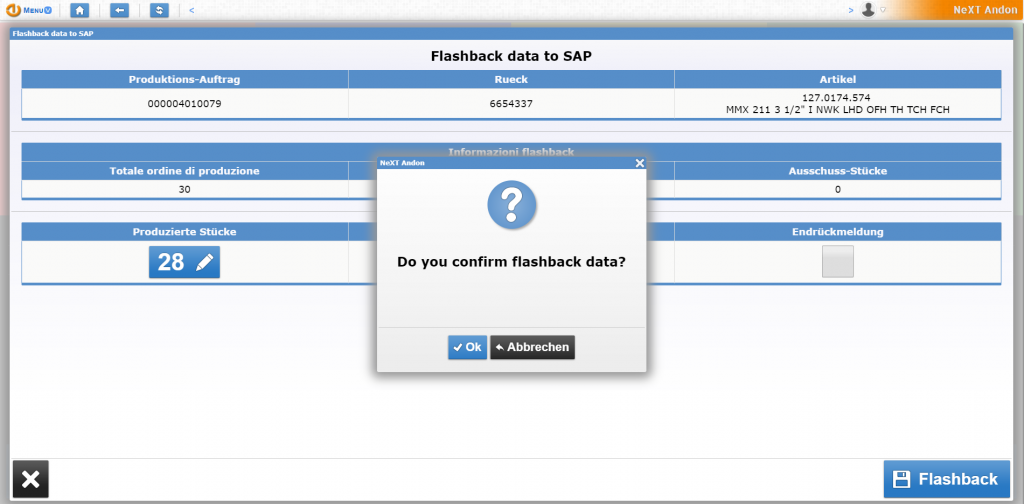
- When the operator presses the "Flashback" button, the system asks for confirmation of the operation
In the office
NIS web platform
The main menu
From the office the user will be able to view, manage and customize the entire NIS system.
All the operations the user can do are listed in the main menu. The menu provides different entries, depending on who is logged.
This is the menu that can see a user with the role of administrator.
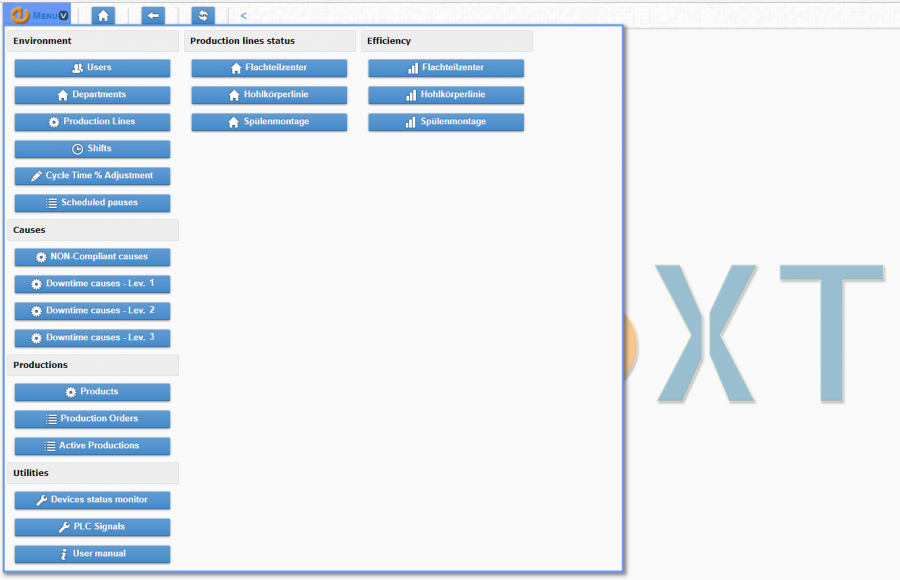
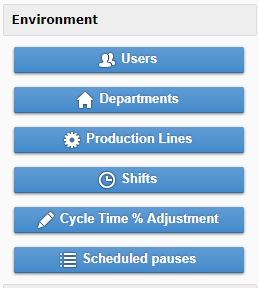
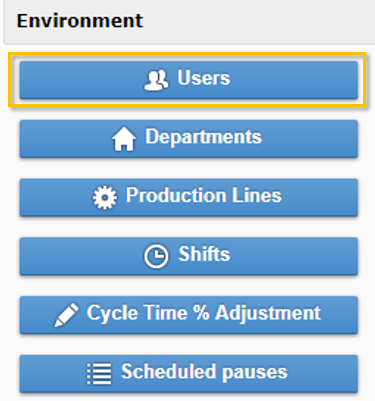
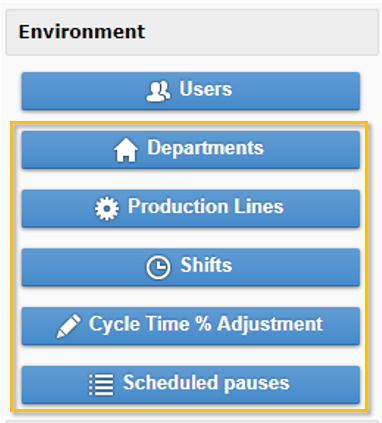
The «Environments» section contains some general voices describing users, departments, lines, shifts, cycle time adjustments and scheduled pauses.
Through each single entry the user will be able to make settings and changes related to the context.
We will deepen this topic in the paragraphs «Users» and «The environment».
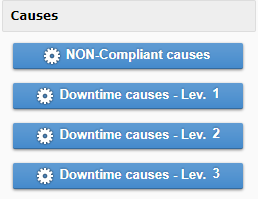
The «Causes» section represents the list of possible downtime or non-compliant causes.
We will deepen this topic in the paragraphs«Non-compliant causes» and «Downtime causes».
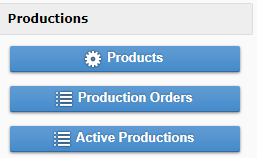
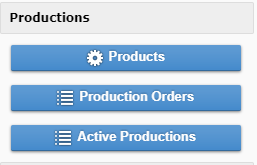
The «Production» section contains the list of products, the list of production orders, and the list of active productions at the moment.
We will deepen this topic in the paragraph «Productions».
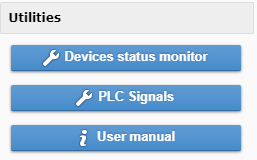
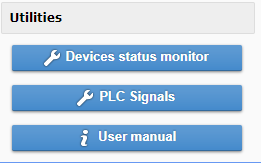
In the «Utilities» section, there are three entries «Devices status monitor», «PLC Signals» and «User manual».
The first, gives access to the list of all devices involved and some control functions; the second shows the signals of a specific PLC; the third gives direct access to a web version manual.
We will deepen this topic in the paragraph «Utilities».
The «Production line status» section lists the monitored lines.
Through this list you will be able to view the data of each line, relating to the Andon: you will be able to view the screen of the Andon board (TV LED) and also the screen of the touch panel.
We will deepen this topic in the paragraph «Production line status».
The «Efficiency» section lists the monitored lines.
Through this list you will be able to view the OEE of today's turn, but you will also be able to view the OEE of that line in a certain period of time.
We will deepen this topic in the paragraph «Efficiency».
Users
The NIS web platform has several roles.
Using the "Users" button, you can add new users, associating it with one or more roles. Depending on the role, each user will have access to different views and functions.
Users and groups can be managed only if the logged in user has the «Administrator» level of rights.
After clicking on the "Users" button, the user have access to the list of already registered users, displaying Name, Surname, username, e-mail, and the roles associated with each of them.
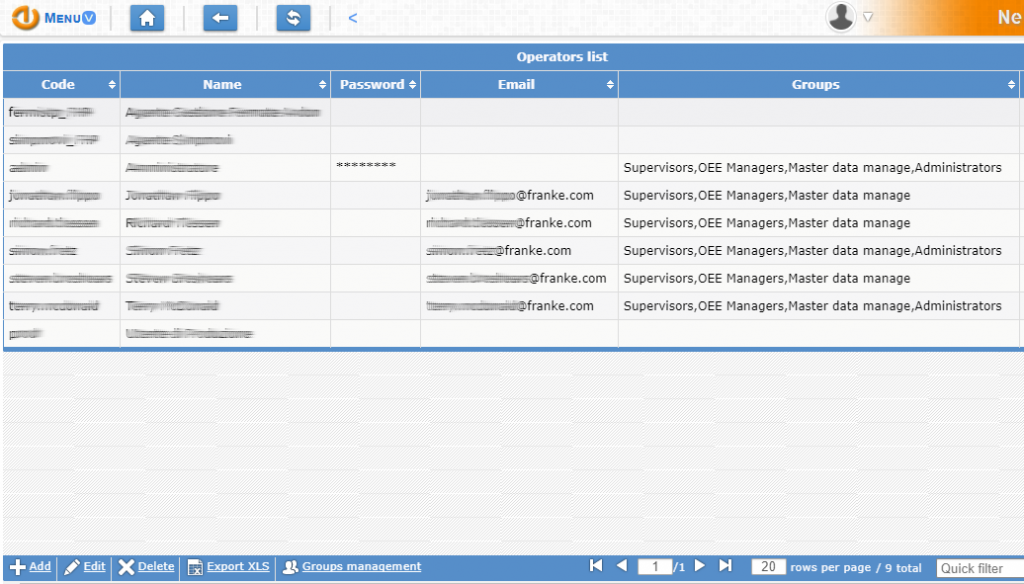
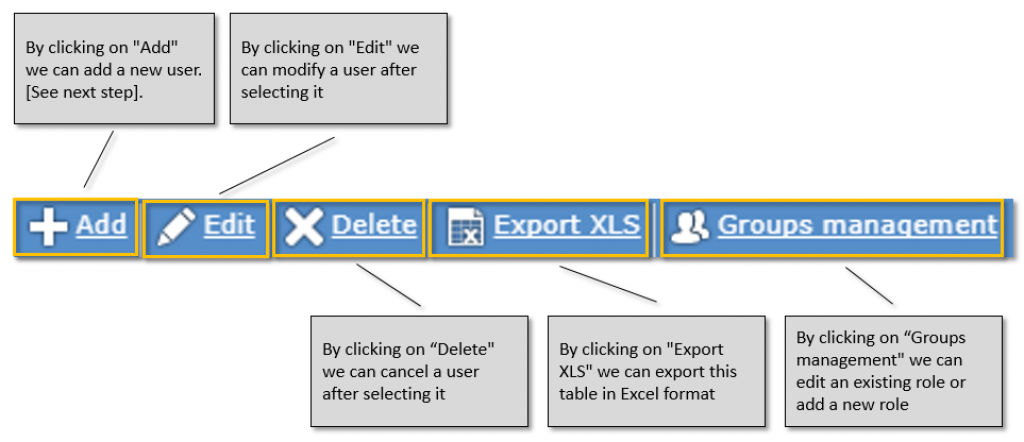
- «Add»: by clicking it, we can add a new user.
- «Edit»: by clicking it, we can modify a user after selecting it.
- «Delete»: by clicking it, we can cancel a user after selecting it.
- «Export XLS»: by clicking on it, we can export this table in Excel format.
- «Groups management»: by clicking on it, we can edit an existing role or add a new role.
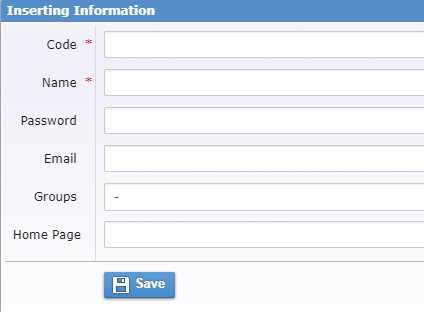
To add a new user, you have to click on "Add". This is the form to fill in to add a new user: "Code" (username) and "Name" are necessary.
By clicking on "Groups management" you can access the list of existing roles. Currently they are: Administrator, Master Data Manager, OEE Managers and Supervisors.
Each role is enabled to perform specific functions:
- Administrator: all functions enabled.
- OEE manager: environment configurations, scrap and stop machine causes, OEE summary, reports.
- Supervisor: all functions except users and groups management
The environment
The remaining entries of the menu "Environment", are used to define the environment in which the NIS system is operational.
So this section include the departments and lines involved, the length of the shifts, the cycle time adjustment, and the the scheduled pauses.
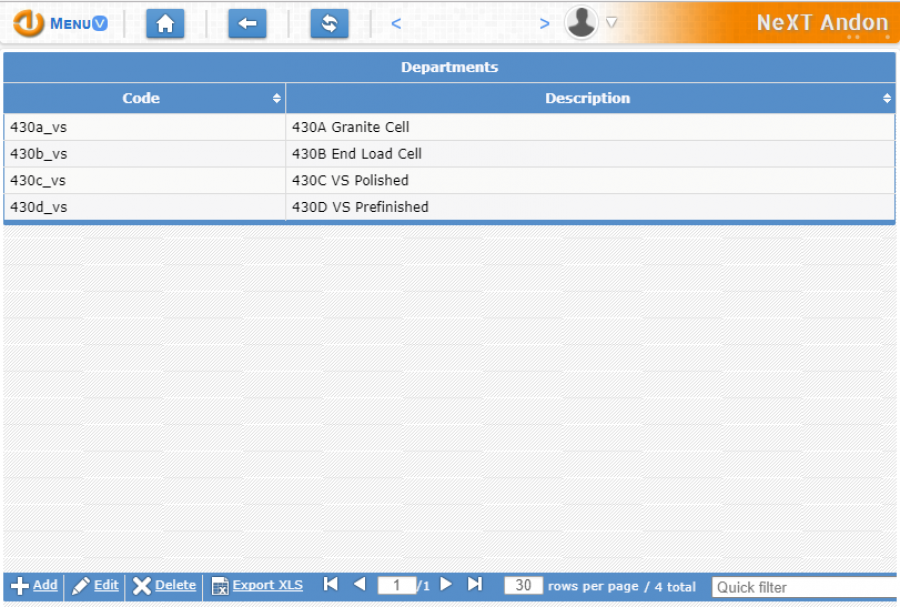
Departments
This section will show the list of departments where the NIS system is installed.
A department can contain one or more production lines.
The user who has the rights to edit this section can add new departments or edit/delete existing ones, or export this table in Excel format.
Production lines
This section will show the list of production lines where the NIS system is installed.
The user who has the rights to edit this section, can add new production lines or edit/delete existing ones, or export this table in Excel format.
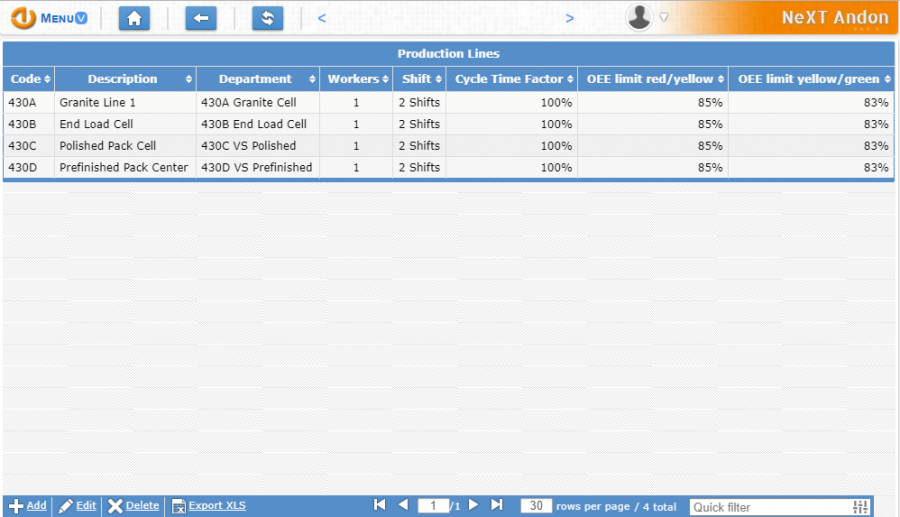
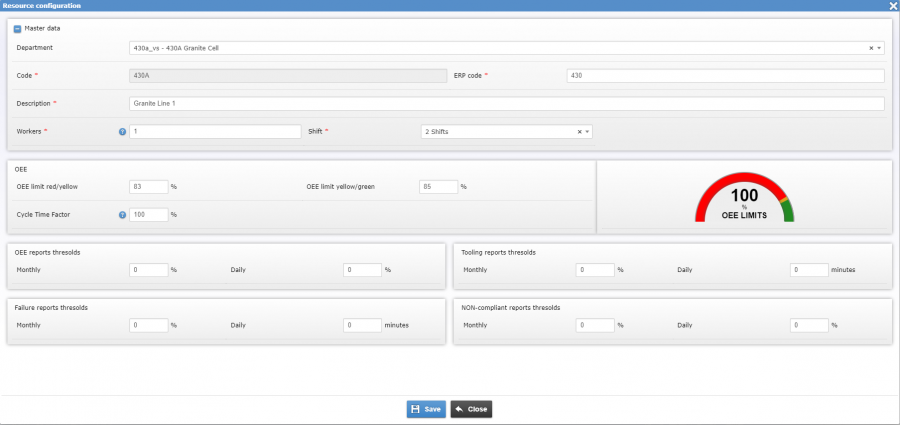
The user, when adds or edits an existing line, will have to set some values such as:
- the department to which the line belongs
- the number of workers (zero means gathered from ERP)
- the number of shifts
- setting OEE percentages, which will be represented by red, yellow and green
- setting the Cycle Time Factor
- setting the thresholds for OEE, failure, tooling and scraps reports (monthly and daily) (see also paragraph «Reports»)
Shifts
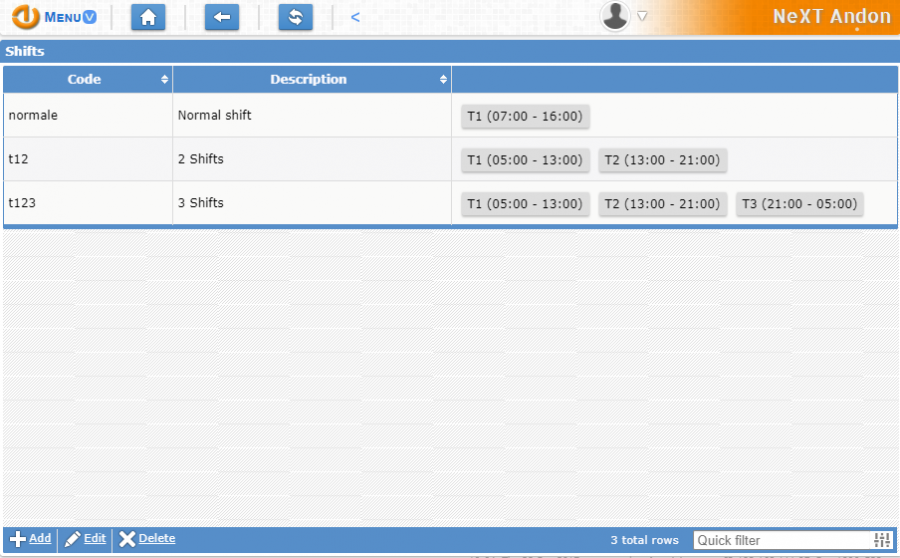
this section will show the list of planned shifts.
The user can add a new shift, or edit an existing shift. He will have to set the start and end of each turn.
The user can also delete an existing shift.
Cycle time % adjustment
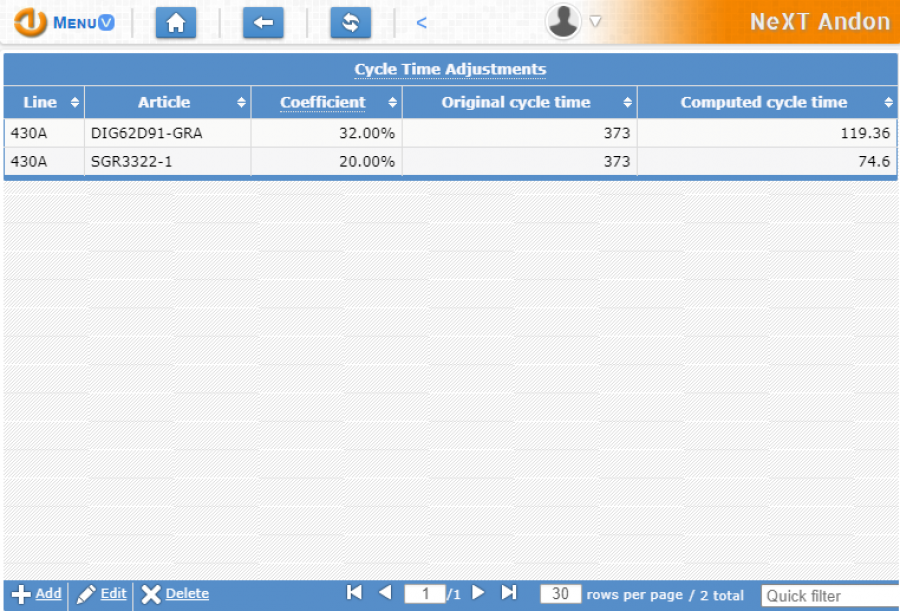
The Cycle time is based on the cycle time gathered from ERP or manually entered by the operator in case of NO ERP data exchange.
It’s coupled by articole code and the line involved. Examples of coefficient adjustments.
- 50% ⇒ cycle time halved
- 100% ⇒ no change applied
- 200% ⇒ cycle time doubled
Scheduled pauses
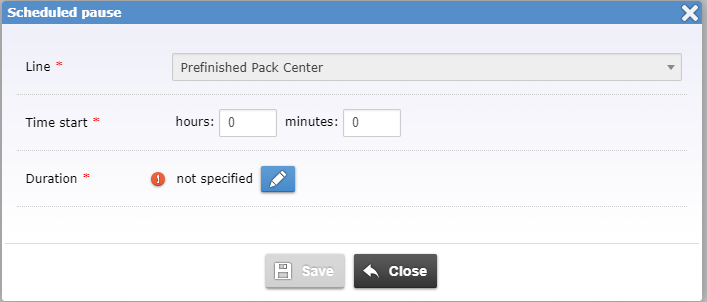
this section shows the list of scheduled pauses. The user can add a new scheduled pause.
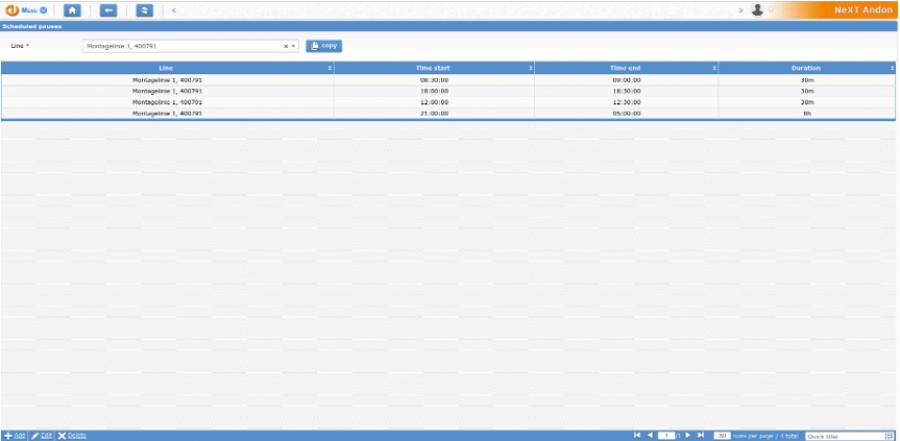
Before adding a new scheduled pause, the user will need to select a production line.
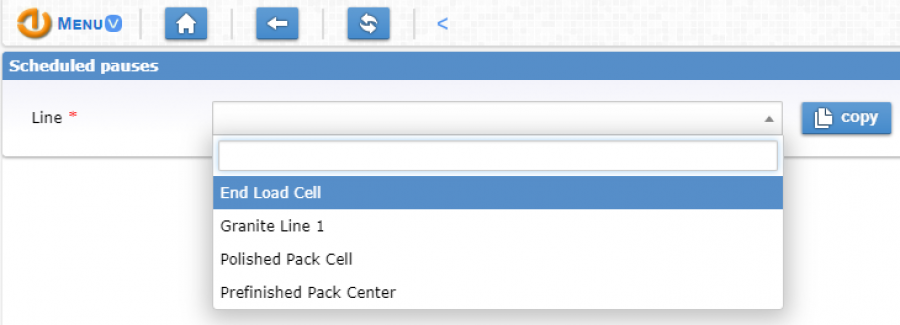
Finally, the user have to specify the start time of the pause and its duration.
Non-compliant causes
The "Causes" section allows the user to manage both the causes of quality problems and machine stops

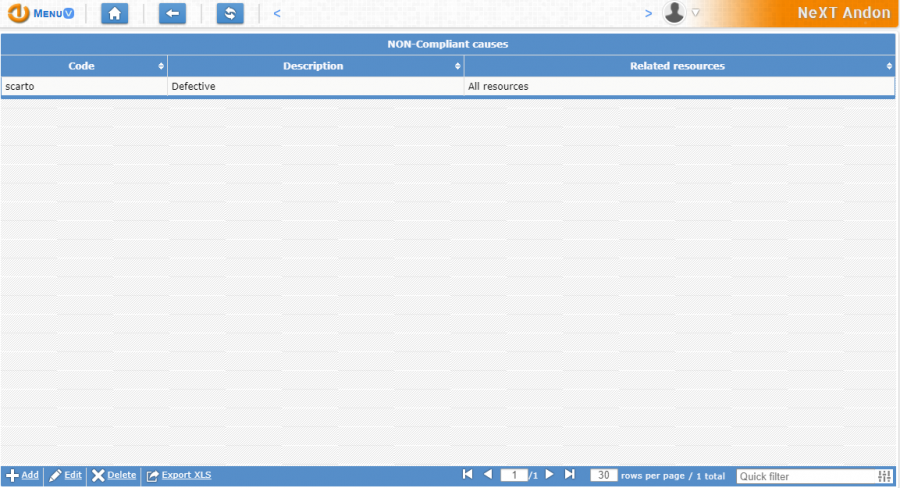
The section Non-compliant causes shows the list of non-compliant causes provided.
The user can add a new cause, cancell or modify an existing one.
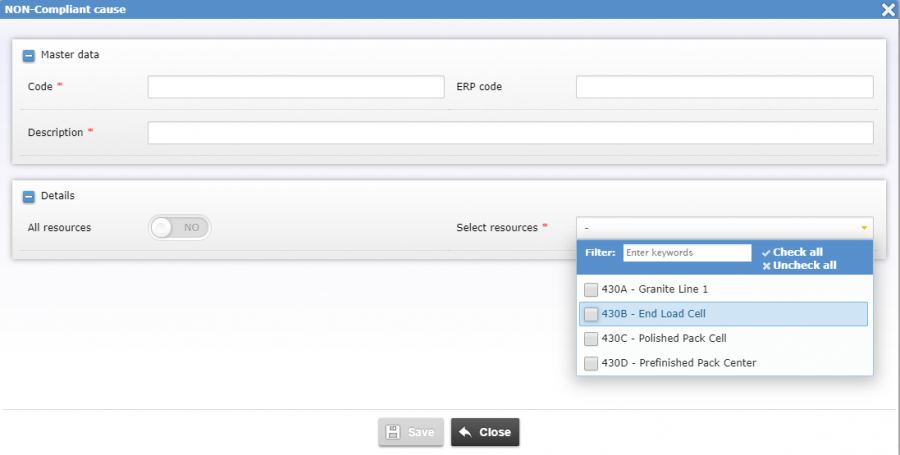
When adding a new non-compliant cause, the user have to give a description and to associate a resource (a production line).
Downtime causes
The downtime causes are all those causes that lead to a stop in production.
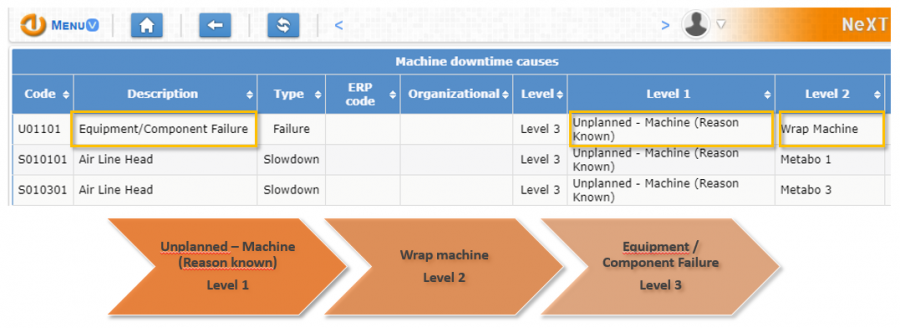
Causes can be of different kind (failure, scheduled or slowdown) and have been organized in three different depths, helping to define more and more in detail the cause of stop
Downtime causes – Lev. 1
This section shows the list of causes for first level.
Each item in the table specifies an identifier code, a description, the type (failure, scheduled or slowdown), the level (1st, 2nd or 3rd).
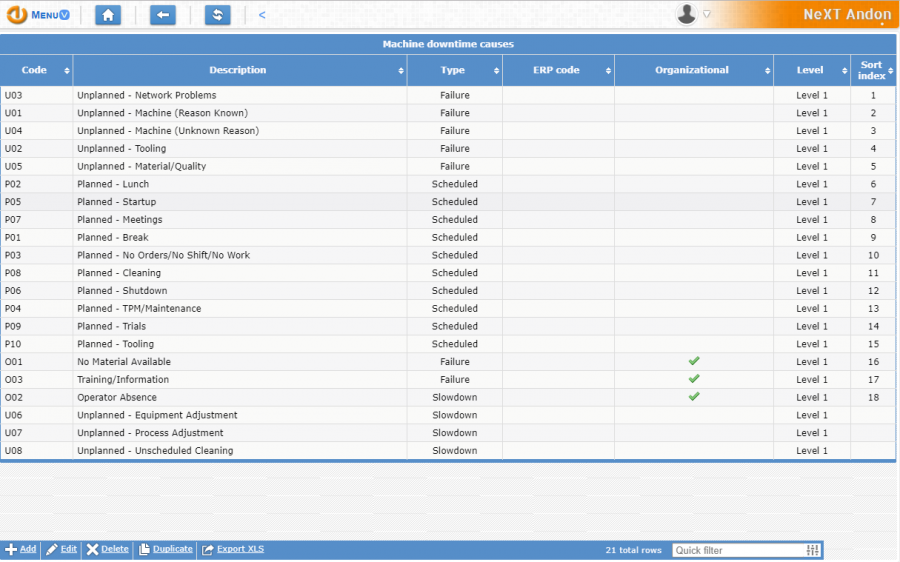
The user who has the rights to edit this section can add new downtime causes or edit/delete existing ones, or export this table in Excel format.
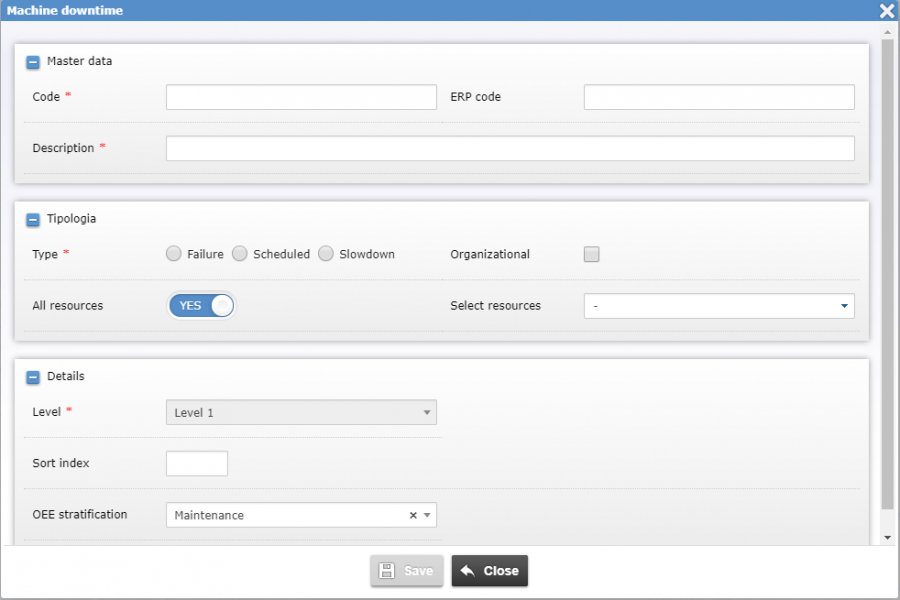
Adding a new downtime causes, the user will have to set some values such as:
- Code and ERP code
- A description of the downtime causes (Ex. «Planned – Lunch»)
- A type («Failure», «Scheduled» or «Slowdown»)
- If it is or not, an organizational causes
- The resource (line) involved
- The level
- Sort of index
- OEE stratification (the user have to select a reason of the stop. See also the paragraph «Reports»)
Downtime causes – Lev. 2 & 3
The tables relating to the downtime causes of 2nd and 3rd levels are similar to each other, but are different from the table of the downtime causes of 1st level.
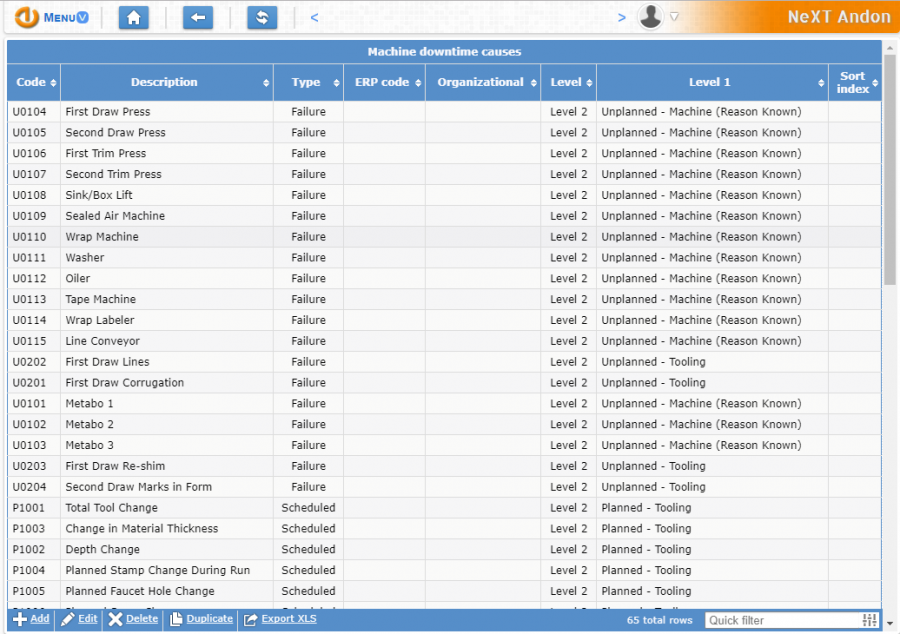
In these tables there is a column reporting the description of the previous level («Level 1» or «Level 2»): in this way it is clear at what level, each sub-level belongs.
Productions
In this section, the user will be able to manage all the products and related production orders and to view and modify the active productions.
Products
This section shows the list of all products.

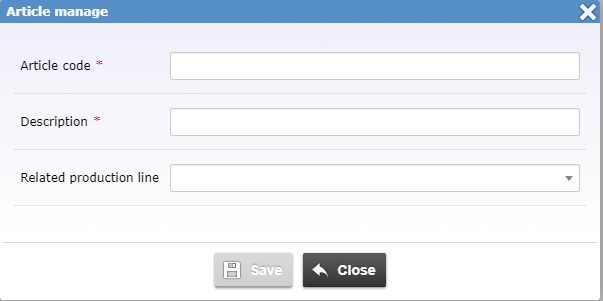
Adding a new product or editing an existing one, the user will have to set some values such as:
- a code
- a description
- the related production line (optional)
Production order
This section shows the list of production orders.
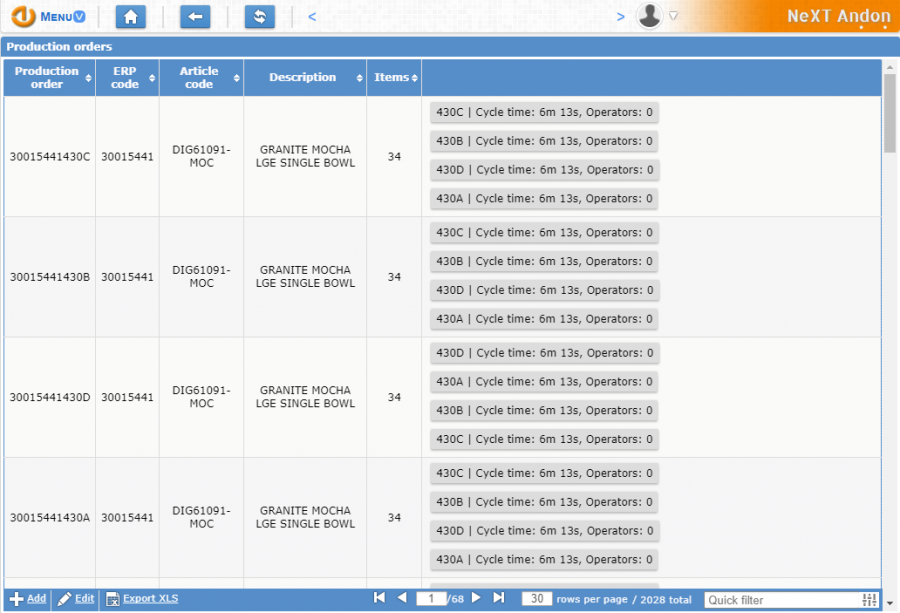
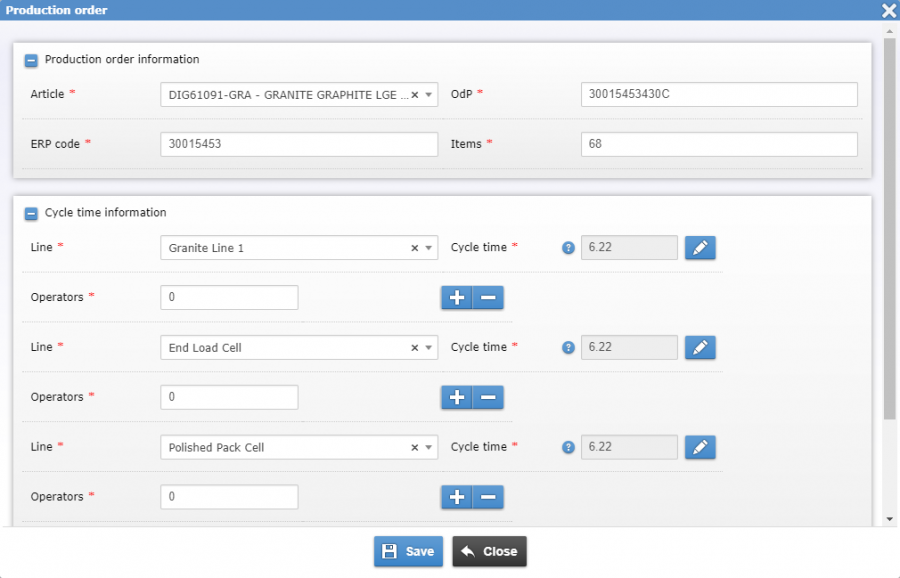
The information in this table relates to:
- the article
- the code of the production order
- the ERP code
- the number of items provided
- the lines where it is possible to work the article, its cycle time and the number of workers involved
Active productions
This section shows the list of active productions at this time.
The information in this table relates to the production order being processed in each line, the cycle time and the start time.
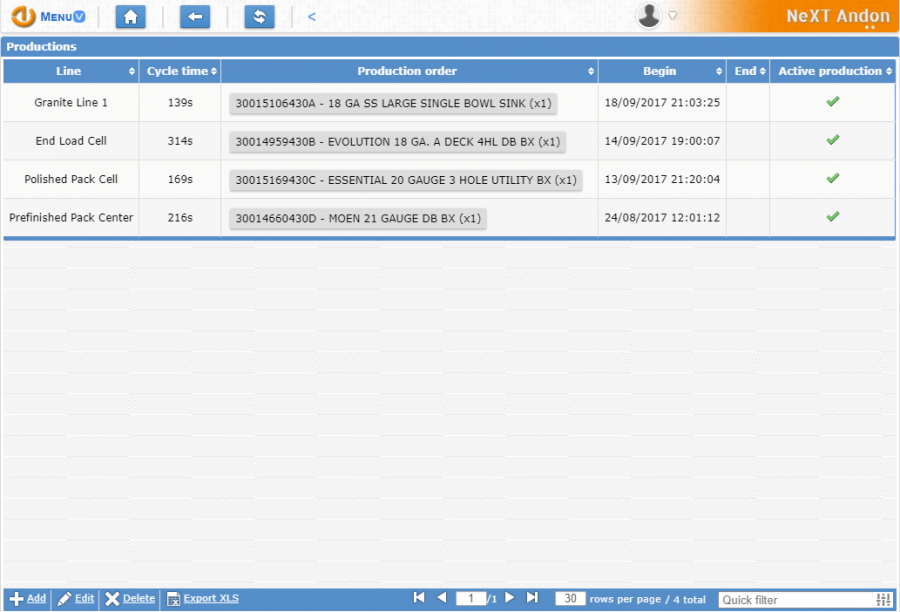
Adding a new active production or editing an existing one, the user will have to provide some data:
- the line
- the production order
- the takt time
Utilities
Devices status monitor
This section shows the list of all devices involved in the NIS system.
For all devices it is possible to know: IP address, MAC address, Name, Type (Tablet, PLC, Computer), Asset (NeXT ID), ID Kiosk, Status and History.
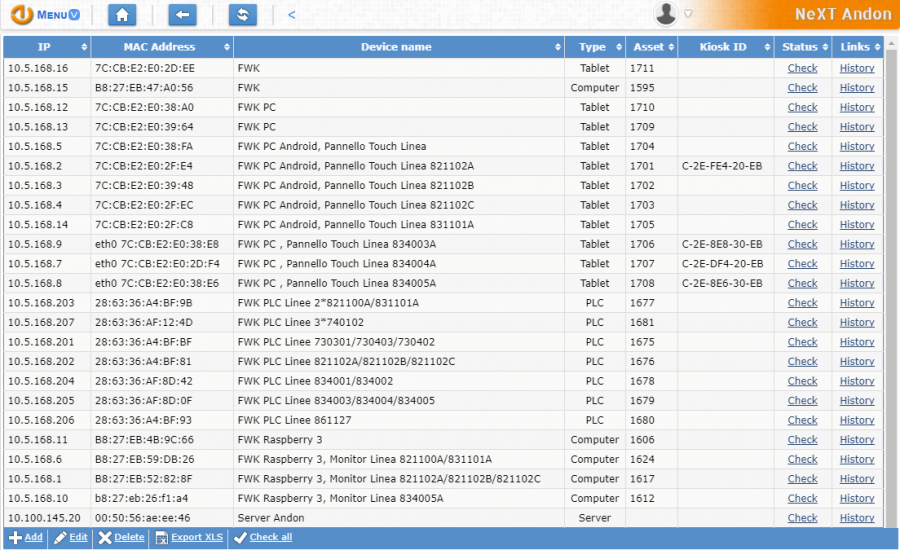
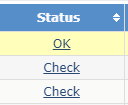
Through the column «Status» the user can to check the status of the device, if it is working or not.
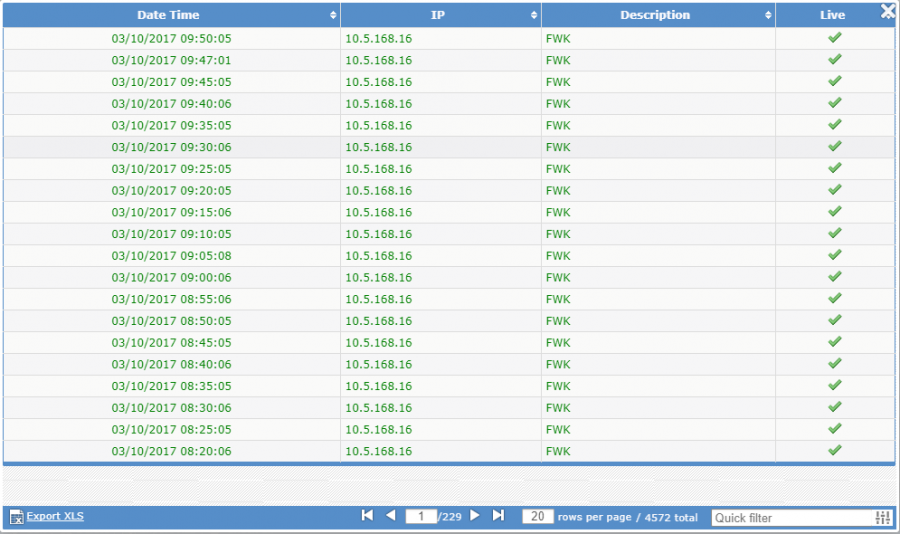
The "History" feature allows the user to see the history of the device's status. These are automatically recorded every 5 minutes.
PLC signals
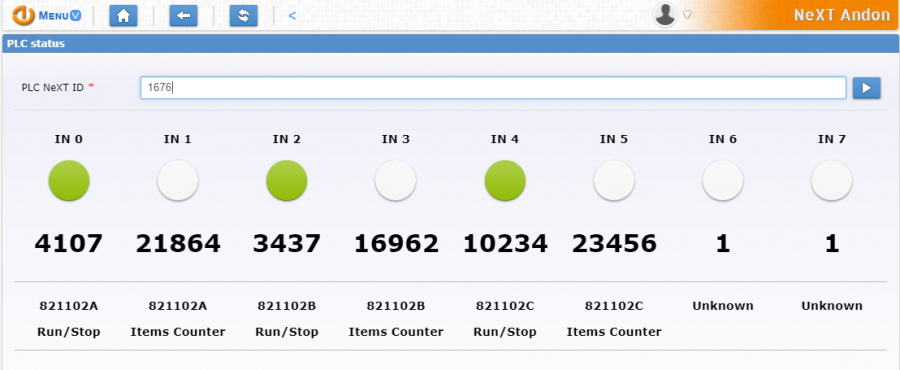
This function allows the user to monitor the signals of a specific PLC.
Entering the PLC Asset Code (PLC NeXT ID) will display all PLC inputs. For each input we can know the type of signal associated and the number of received signals.
Green color means that the signal is 1 (the machine is running or a pieces is counted); white color means that the signal is 0 (the machine is stopped or a piece is not completed)
User manual
Reports
Through the NIS web application the user can view some reports.
Production line status
This section shows the list of departments involved in the NIS system.
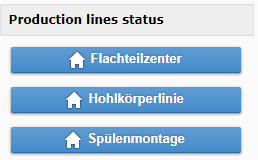
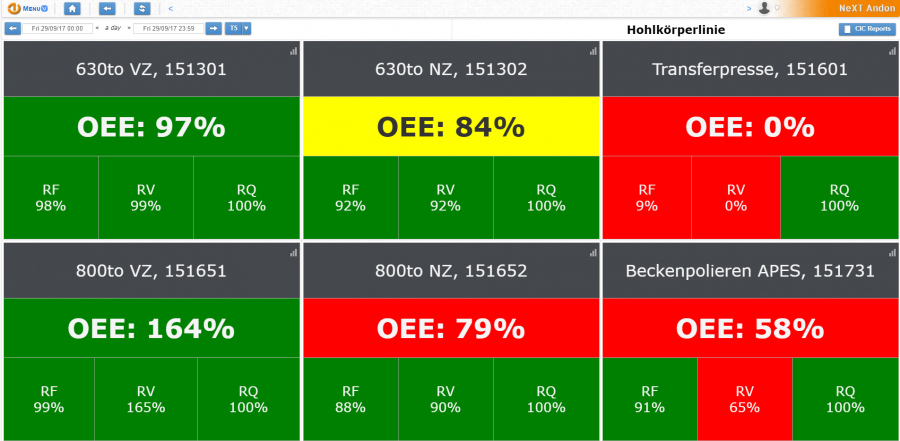
By clicking on one of the departments (for example, «Hohlkorperline»), the user can see a summary of the real time efficiency of the lines (six in this case) in that department.
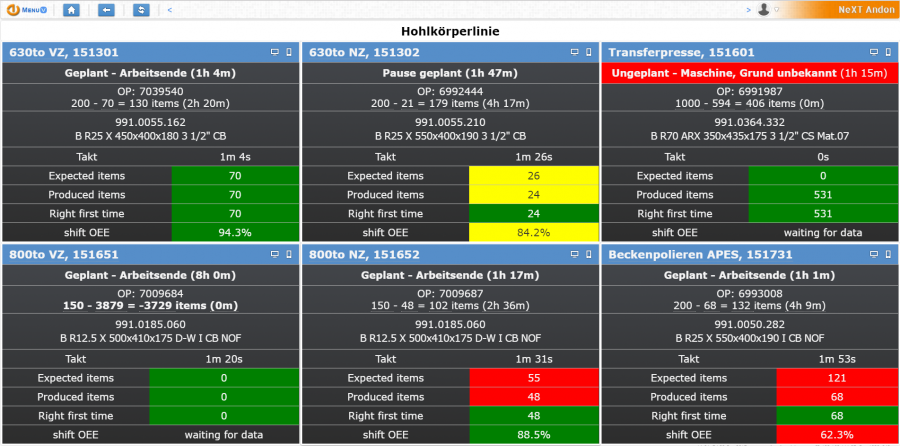
At the top on the right of each box there are two buttons:
- the button on the left (1) allows to display the TV LED screen;
- the button on the right (2) allows to display the touch panel screen.

(1) This is an example of a TV LED screen, present on each line.
The detailed description of the information shown on the LED TV can be found in the paragraph «The Andon board interface»
(2) This is an example of a touch panel screen, present on each line.
The detailed description of the touch panel interface can be found in the paragraph «The touch panel interface»
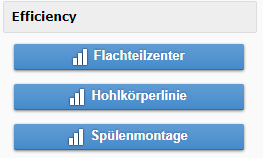
Efficiency
This section shows the list of departments involved in the NIS system.
By clicking on one of the departments (for example, «Hohlkorperline»), the user can see a summary of the Overall Equipment Effectiveness (OEE) value
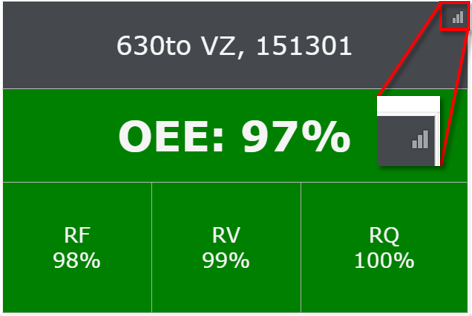
At the top on the right of each box there is a button. It allows:
- to display the OEE value of that line, in a certain period
- to access to some reports
Thie following image shows the OEE interface. By default, it shows the OEE value of the current day, hour by hour, starting from the beginning of the shift.
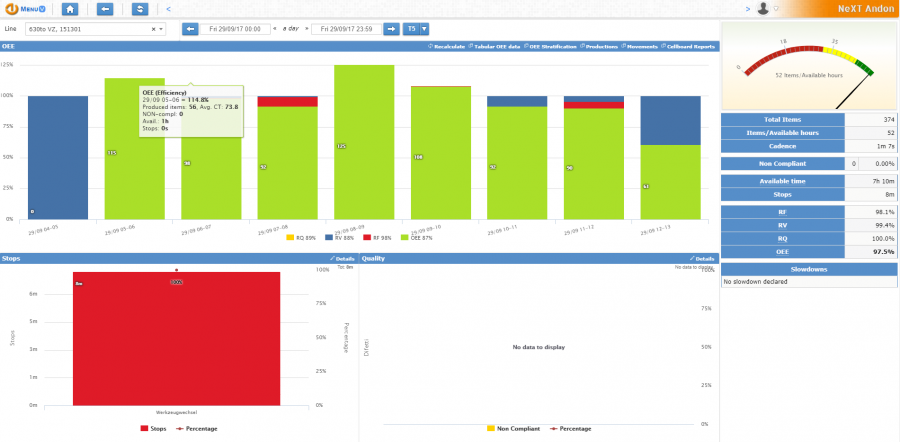
At the top of the interface the user can choose the line to be analyzed, the time span to view (today, yesterday, current week, last week, current month, last month, current year last year).

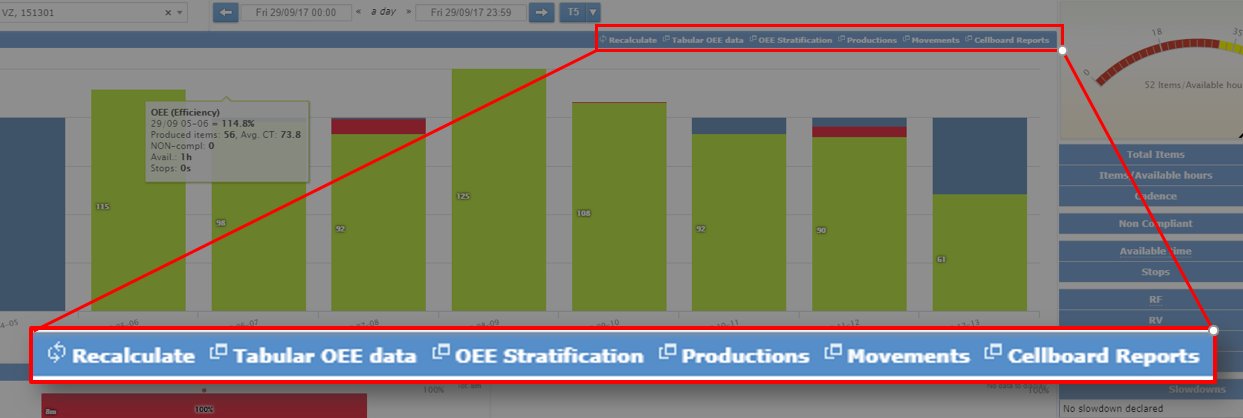
Below, we find a series of buttons that allow the user to view a series of reports.
This topic will be discussed in the paragraph «Reports».

In the middle of the interface, a series of histograms show the OEE value, hour by hour.
The different colors refer to:
- Yellow: stop for a quality problem (scrap)
- Blue: speed loss
- Red: stop machine
- Green: the OEE

At the bottom of the interface you can see details about losses due to machine stops and scraps.
The duration of each stop is immediately visible.

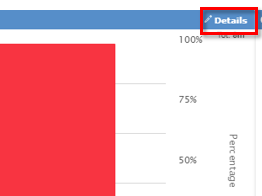
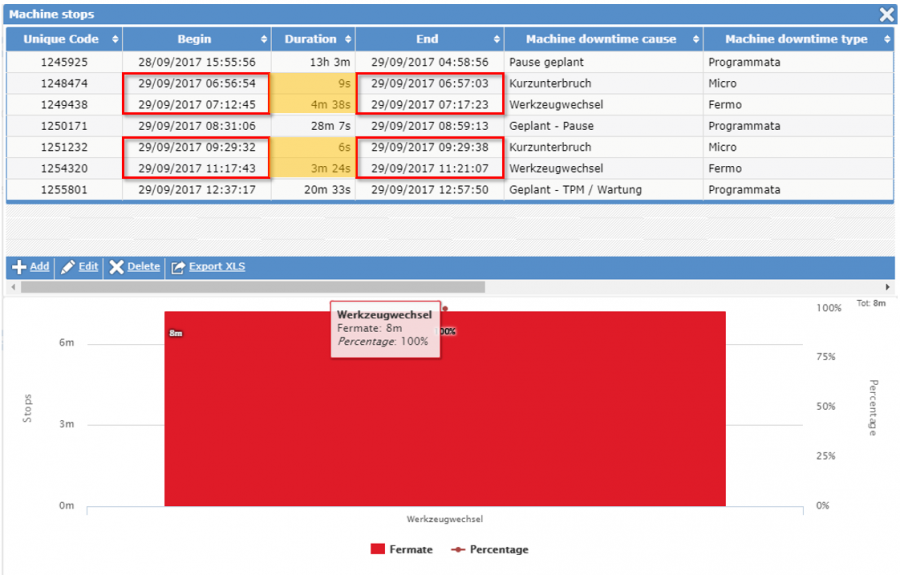
By clicking on «Details» you can deepen the knowledge by going to see the start and end of each stop.
Here the user can see the stops (not scheduled) that contribute to the amount of minutes we saw in the previous screen. For each stop we know the start time and the end time.
The user can export this table in excel format.
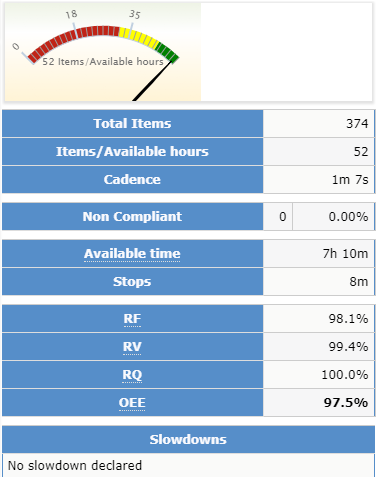
In the following chart, the user can find a variety of information.
- total items produced
- items processed for one hour
- cadence
- non-compliant items
- time available
- stop minutes
- RF: Machine efficiency
- RV: efficiency of machine availability
- RQ: Object quality efficiency
- OEE
Reports
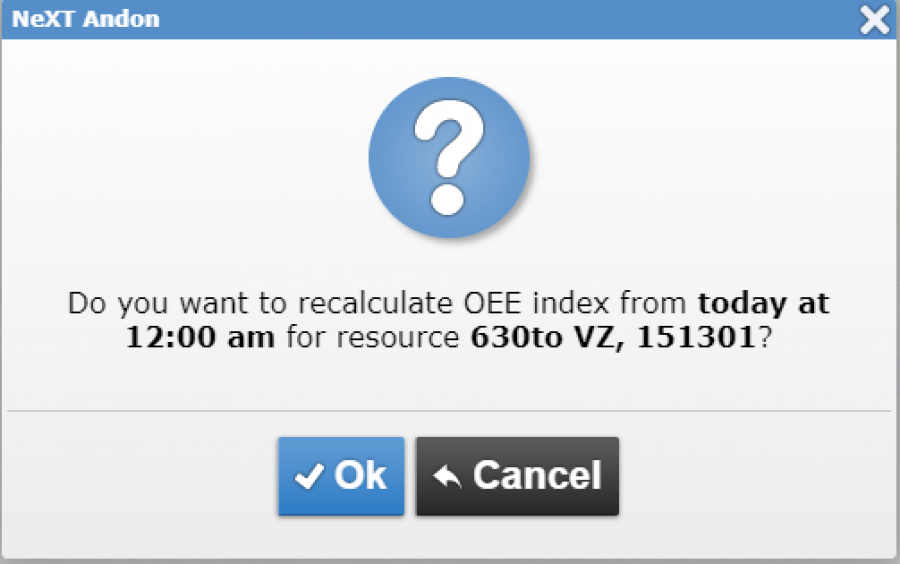
Recalculate
The "Recalculate" function allows the NIS system to recalculate the OEE.
For example, this function is very useful if, at a later time, the cause of a stop has to be changed: from a stop programmed to an unplanned stop.
This change affects the calculation of OEE, so a recalculation is required.
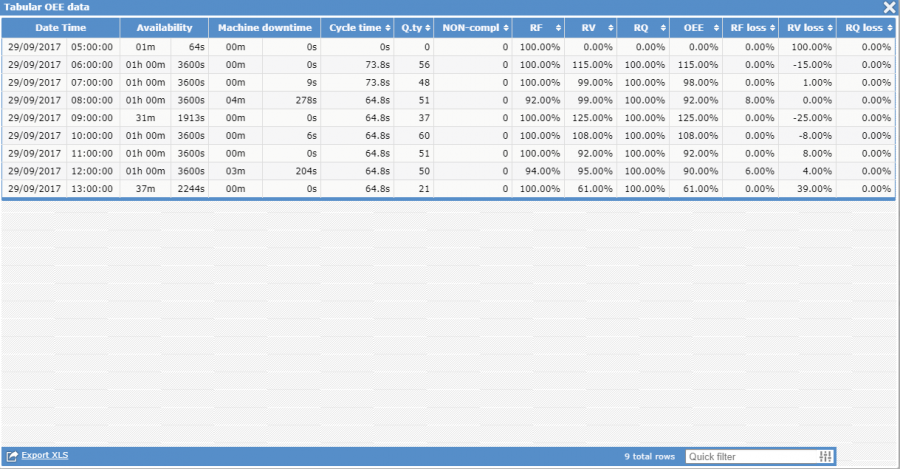
Tabular OEE data
This feature allows the user to view all OEE data in tabular form. This table can also be exported to Excel format.
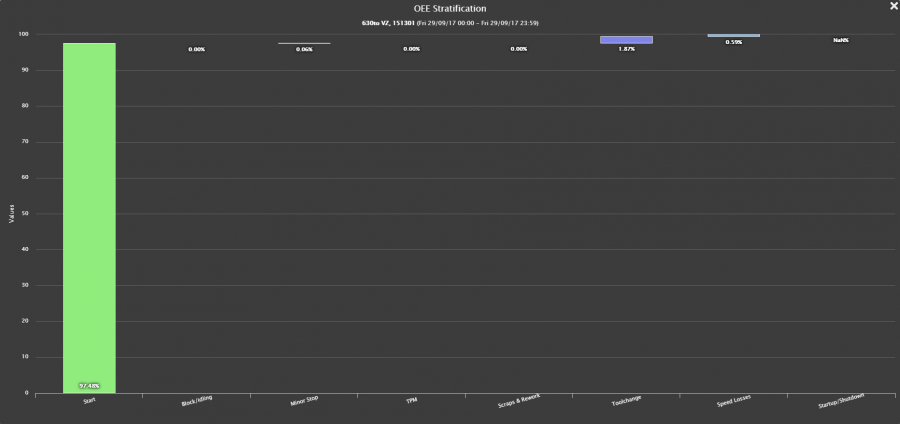
OEE stratification
The "OEE stratification" function allows the user to view all causes of stop (block, minor stop, TPM, Scraps & Rework, Toolchange, Speed Losses, Startup / Shutdown) and the value of the OEE.
The goal is achieved using a graph that highlights the most frequent stops in the selected time span.
Productions
This function allows the user to view a list of productions made in the selected time frame in a table format.
The user can read the order of production, the article code, the cycle time, the number of items produced, the number of non-compliant items, the start time of processing, the end time of processing.

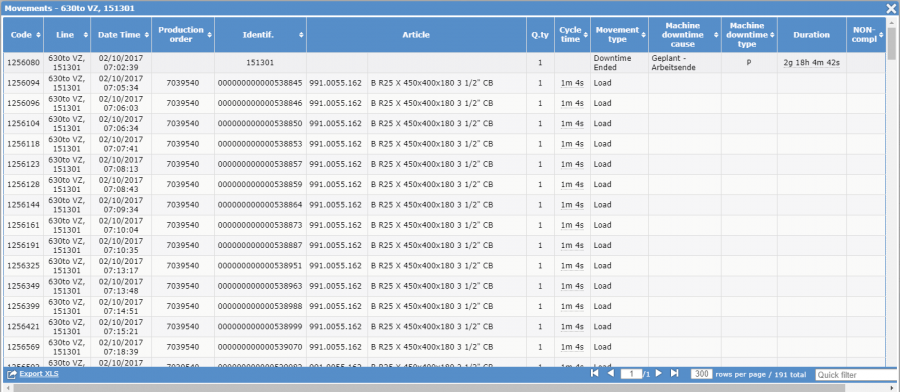
Movements
This function allows the user to view the entire list of events, in the time interval selected: produced items, cycle time, type of movement (load or downtime), cause of downtime, type of downtime, duration of downtime, non-compliant items.
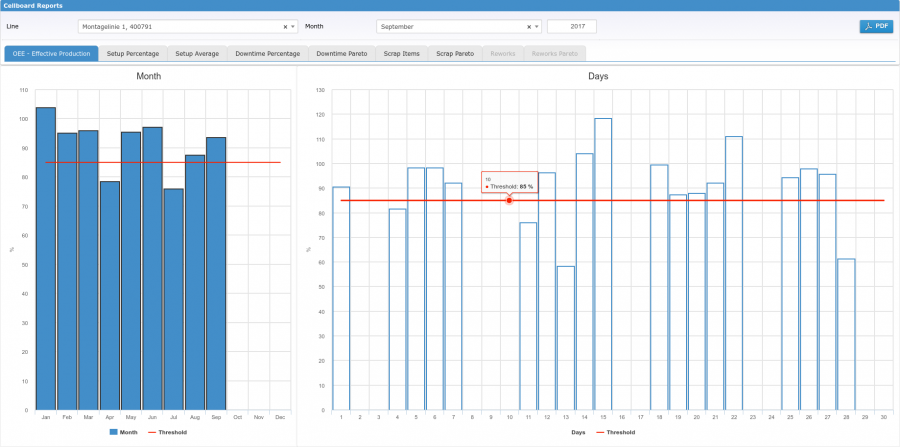
Cellboard Reports – OEE effective production
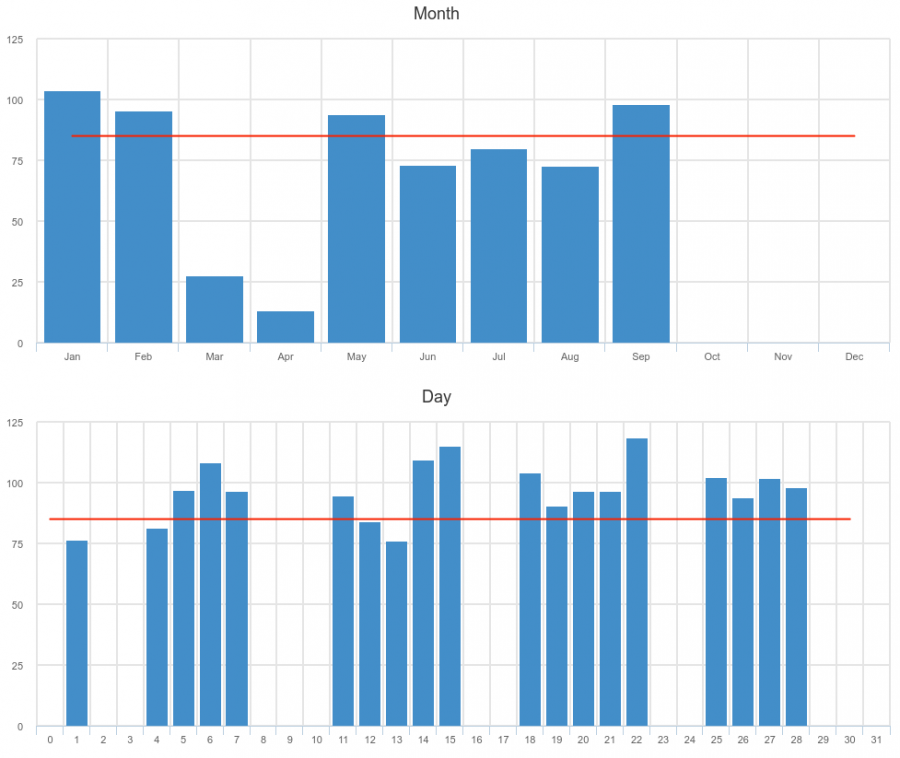
In this report, the user can see the monthly and daily OEE value (relative to the selected month).
In red, the user can see the treshold limit configured under "Production lines" in the "Environment" menu.
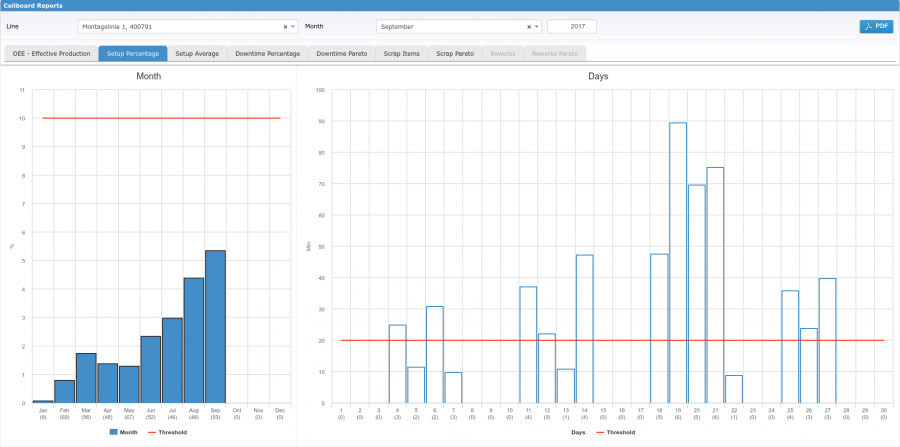
Cellboard Reports – setup percentage
This function reports, on the left, as a percentage, the length of setup (tooling) over the entire time span (monthly).
On the right, this function shows, the time in minutes of setup, compared to the entire time span (daily).
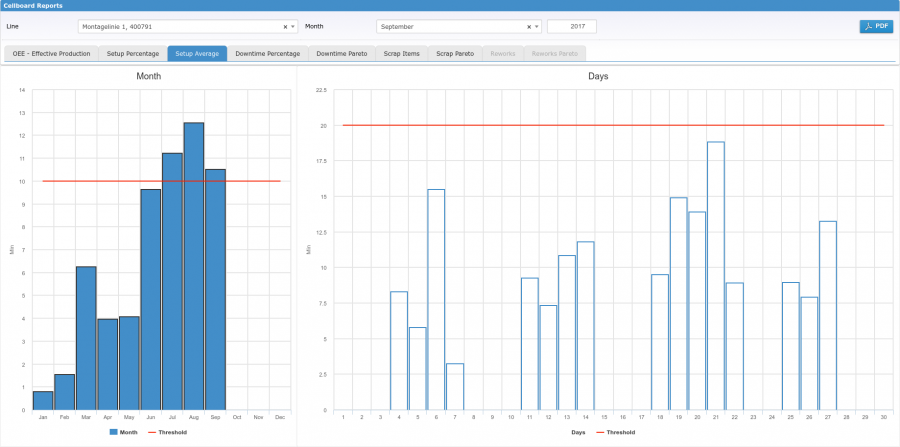
Cellboard Reports – setup average
This function shows the average length of the setup (tooling) in minutes, each month (on the left) or day by day in the selected month (on the right).
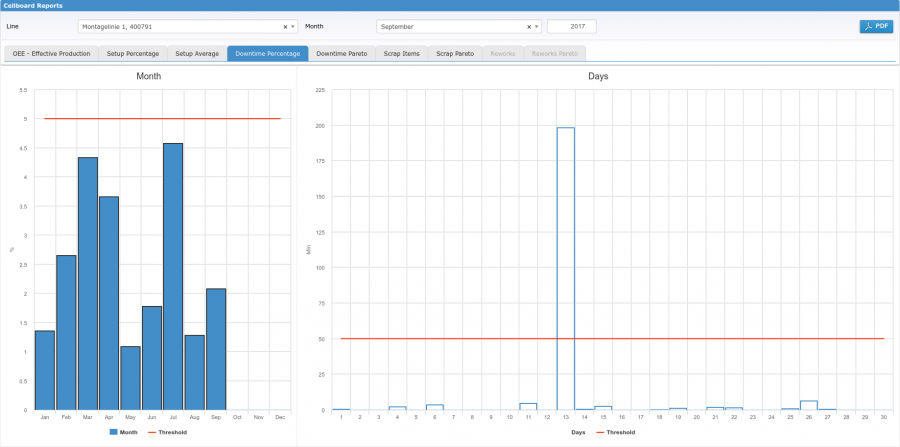
Cellboard Reports – downtime percentage
This function reports, on the left, as a percentage, the length of downtime over the entire time span (monthly).
On the right, instead, this function shows, the time in minutes of downtime, compared to the entire time span (daily).
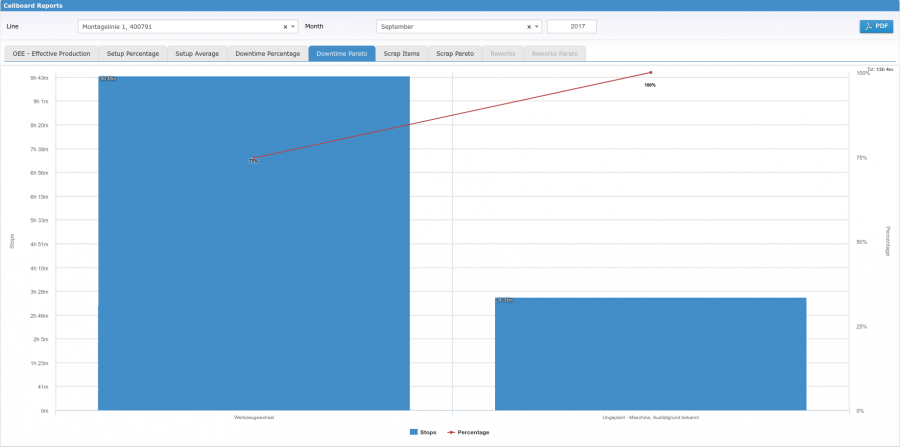
Cellboard Reports – downtime Pareto
This function shows the various causes of downtime that have occurred, in percentage, using the Pareto graph.
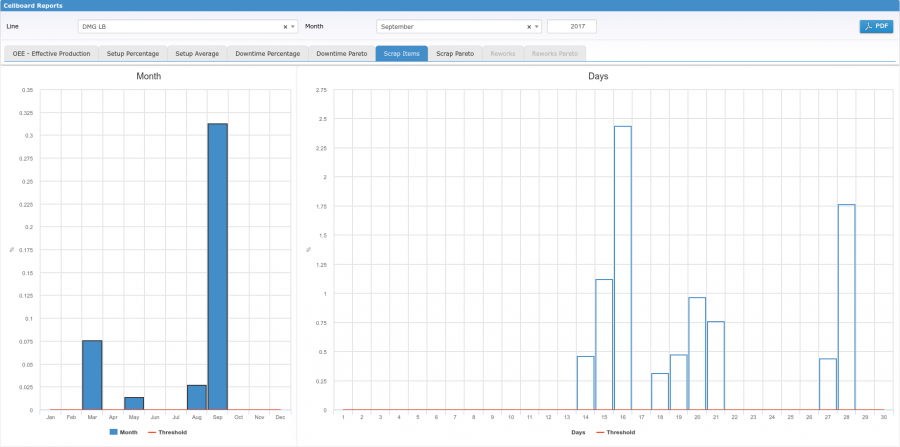
Cellboard Reports – scrap items
This function reports, as a percentage, the length of scrap items over the entire time span (monthly on the left, daily on the right).
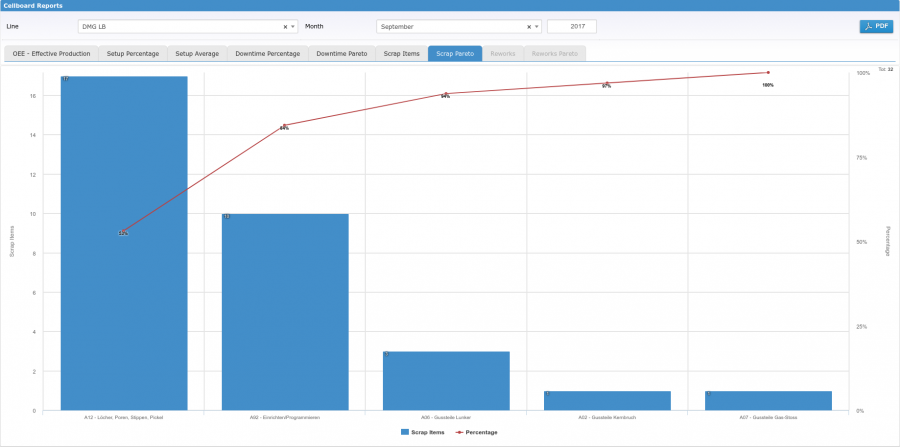
Cellboard Reports – scrap Pareto
This function shows the various causes of quality problems that have occurred, in percentage, using the Pareto graph.
OEE overview
How does it works
The OEE overview is the central application for management. It allowed:
- hierarchical organization of the Franke group based on macro areas
- step by step focus on macro areas, plants, departmens, production resources
- data warehouse used for computation
The hierarchical order is:
- Franke
- macroarea (eg "Sinks stainless steel")
- plants
- departments
- production lines
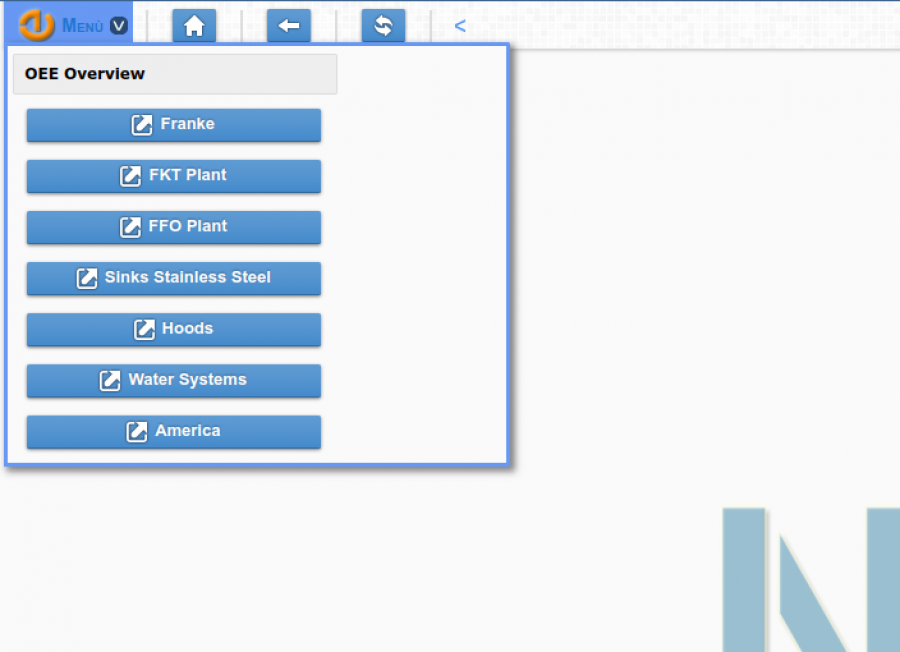
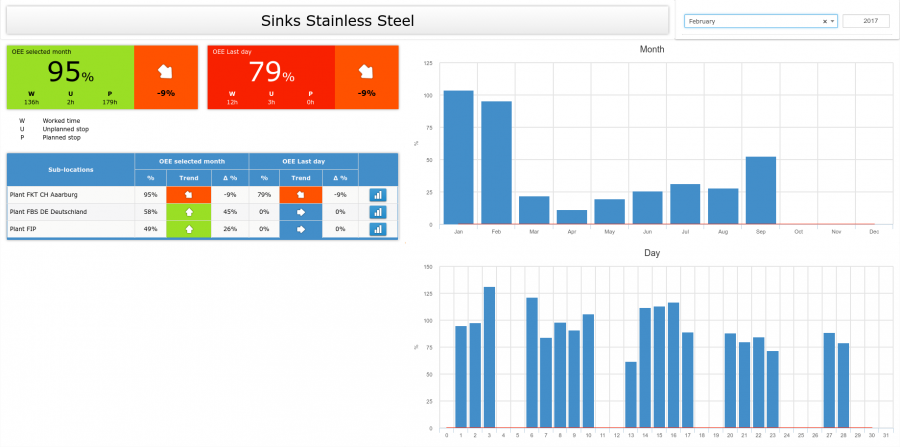
Once you click on a macro area, you can see:
- the plants that are part of it (sub-locations).
- the monthly OEE value (with graph)
- the last day OEE value (with graph)
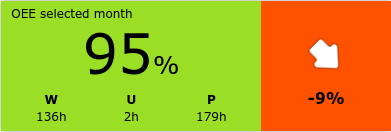
- OEE of selected month with trend indicator (related to the previous month) and % variation
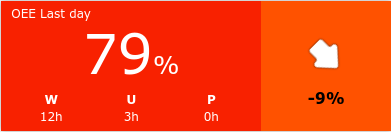
- OEE of last day with trend indicator (related to the previous day) and % variation
- direct access to detailed information of the single sub-location
- W: worked time (hours)
- U: unplanned stops (hours)
- P: planned stops (hours)
- colors are based on OEE thresholds (same as andon boards)
Trend percentage between current selection and previous period
- selected month ⇒ previous month
- colors are based on predefined percentage values (-10%, -5%, 0, +5%, +10%)
- W: worked time (hours)
- U: unplanned stops (hours)
- P: planned stops (hours)
- colors are based on OEE thresholds (same as andon boards)
Trend percentage between current selection and previous period
- last month ⇒ the day before
- colors are based on predefined percentage values (-10%, -5%, 0, +5%, +10%)
- monthly OEE
- daily OEE related to the selected period (month, year)
- thresholds defined for C.I.C. reports
